- Home >
- Stock Photos >
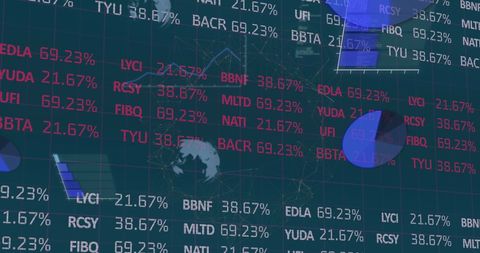
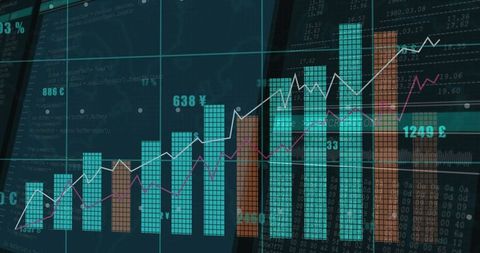
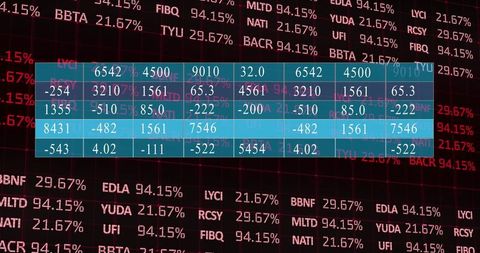
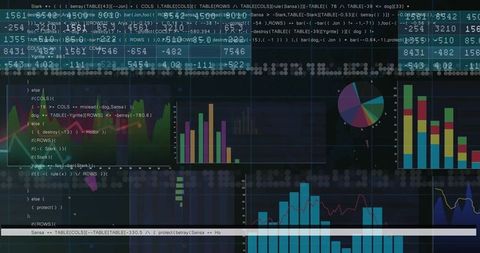
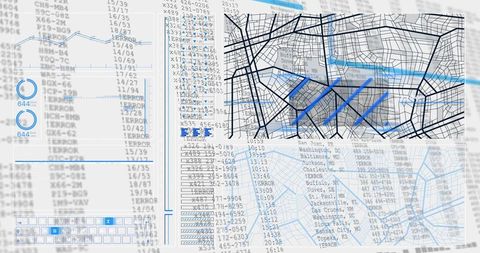
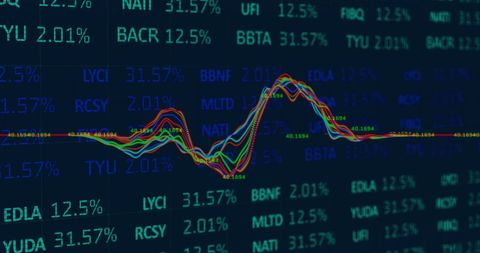
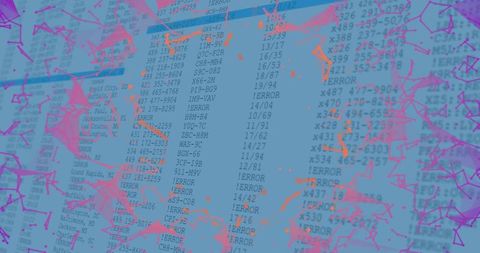
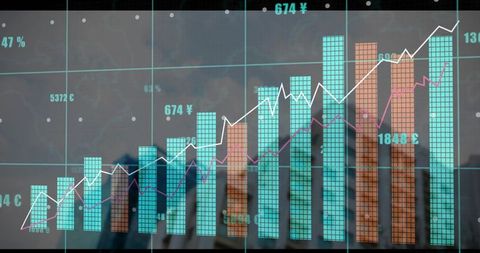
- Complex Data Visualization on Digital Dashboard Interface
Complex Data Visualization on Digital Dashboard Interface Image

Vibrant and dynamic depiction of complex data on a digital dashboard illustrating analytics and trend analysis. Featuring teal and orange graph bars with white and magenta trend lines, laid over a coded background, this image is suited for use in articles on data science, programming, business analytics, or futuristic technology interfaces. Ideal for visual content regarding financial markets, tech apps, or educational materials on digital analytics tools.

downloads
Tags:
More
Credit Photo
If you would like to credit the Photo, here are some ways you can do so
Text Link
photo Link
<span class="text-link">
<span>
<a target="_blank" href=https://pikwizard.com/photo/complex-data-visualization-on-digital-dashboard-interface/aa43f26864f7dca7984973334d994f09/>PikWizard</a>
</span>
</span>
<span class="image-link">
<span
style="margin: 0 0 20px 0; display: inline-block; vertical-align: middle; width: 100%;"
>
<a
target="_blank"
href="https://pikwizard.com/photo/complex-data-visualization-on-digital-dashboard-interface/aa43f26864f7dca7984973334d994f09/"
style="text-decoration: none; font-size: 10px; margin: 0;"
>
<img src="https://pikwizard.com/pw/medium/aa43f26864f7dca7984973334d994f09.jpg" style="margin: 0; width: 100%;" alt="" />
<p style="font-size: 12px; margin: 0;">PikWizard</p>
</a>
</span>
</span>
Free (free of charge)
Free for personal and commercial use.
Author: Awesome Content