
- Home >
- Stock Photos >
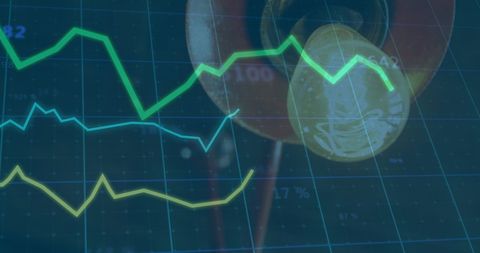
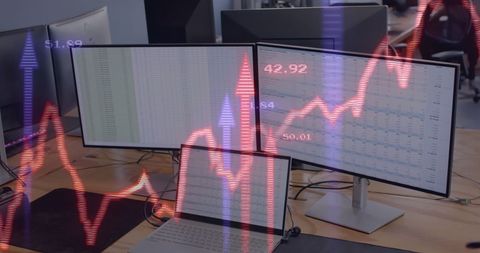
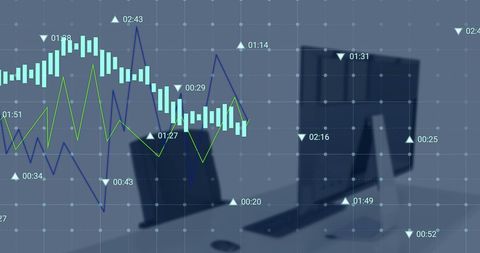
- Computer Displaying Red Line Graph on Digital Charts
Computer Displaying Red Line Graph on Digital Charts Image

Computer screen showcases a digital performance chart with fluctuating red line graph representing financial analytics. Symbolizes data processing, economic trends, and technology. Ideal for illustrating business insights, financial reports, economic analyses, or technology-related articles.
Powered by 


downloads
Tags:
More
Credit Photo
If you would like to credit the Photo, here are some ways you can do so
Text Link
photo Link
<span class="text-link">
<span>
<a target="_blank" href=https://pikwizard.com/photo/computer-displaying-red-line-graph-on-digital-charts/1448abcf3af41ad41d5329dc7037aa96/>PikWizard</a>
</span>
</span>
<span class="image-link">
<span
style="margin: 0 0 20px 0; display: inline-block; vertical-align: middle; width: 100%;"
>
<a
target="_blank"
href="https://pikwizard.com/photo/computer-displaying-red-line-graph-on-digital-charts/1448abcf3af41ad41d5329dc7037aa96/"
style="text-decoration: none; font-size: 10px; margin: 0;"
>
<img src="https://pikwizard.com/pw/medium/1448abcf3af41ad41d5329dc7037aa96.jpg" style="margin: 0; width: 100%;" alt="" />
<p style="font-size: 12px; margin: 0;">PikWizard</p>
</a>
</span>
</span>
Free (free of charge)
Free for personal and commercial use.
Author: Creative Art
Similar Free Stock Images
Loading...

Premium

Premium

Premium


Premium


Premium


Premium

Premium


Premium


Premium

Premium


AI

AI


Premium
Premium

Premium


Premium


Premium


Premium

AI


Premium


Premium


Premium


Premium


Premium


Premium

Premium


Premium


Premium

Explore More Free Stock Images