- Home >
- Stock Photos >
- Covid-19 Cells Over Statistical Data Charts
Covid-19 Cells Over Statistical Data Charts Image
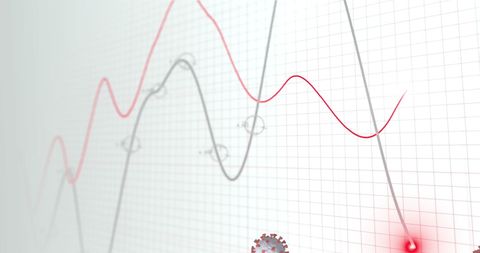
This depiction shows Covid-19 virus representations alongside fluctuating statistical data graphs. Useful for illustrating pandemic impacts on health statistics and data analysis presentation, while providing a visual representation of how Covid-19 continues to influence global and individual health trends.
Powered by  - Get 15% off with code: PIKWIZARD15


2
downloads
downloads
Tags:
More
Credit Photo
If you would like to credit the Photo, here are some ways you can do so
Text Link
photo Link
<span class="text-link">
<span>
<a target="_blank" href=https://pikwizard.com/photo/covid-19-cells-over-statistical-data-charts/6d03a1e8e03e073693850742dd451df0/>PikWizard</a>
</span>
</span>
<span class="image-link">
<span
style="margin: 0 0 20px 0; display: inline-block; vertical-align: middle; width: 100%;"
>
<a
target="_blank"
href="https://pikwizard.com/photo/covid-19-cells-over-statistical-data-charts/6d03a1e8e03e073693850742dd451df0/"
style="text-decoration: none; font-size: 10px; margin: 0;"
>
<img src="https://pikwizard.com/pw/medium/6d03a1e8e03e073693850742dd451df0.jpg" style="margin: 0; width: 100%;" alt="" />
<p style="font-size: 12px; margin: 0;">PikWizard</p>
</a>
</span>
</span>
Free (free of charge)
Free for personal and commercial use.
Author: Creative Art
Similar Free Stock Images

Premium


Premium


Premium


Premium


Premium


Premium


Premium


Premium


Premium


Premium


Premium


Premium


Premium


Premium


Premium


Premium


Premium


Premium


Premium


Premium


Premium


Premium


Premium


Premium