- Home >
- Stock Photos >
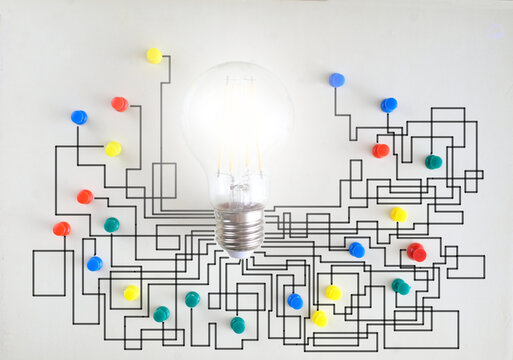
- Creative Light Bulb Maze for Data Processing and Analysis
Creative Light Bulb Maze for Data Processing and Analysis Image

Visual representation of innovative problem-solving and brainstorming through a light bulb image featuring a maze inside. Suitable for illustrating concepts related to data processing and analysis. Can be used in digital marketing for tech companies, educational materials on problem-solving techniques, or presentations on innovative technologies.
Powered by 


downloads
Tags:
More
Credit Photo
If you would like to credit the Photo, here are some ways you can do so
Text Link
photo Link
<span class="text-link">
<span>
<a target="_blank" href=https://pikwizard.com/photo/creative-light-bulb-maze-for-data-processing-and-analysis/e02f98f951d052ab111d674f4950b6a9/>PikWizard</a>
</span>
</span>
<span class="image-link">
<span
style="margin: 0 0 20px 0; display: inline-block; vertical-align: middle; width: 100%;"
>
<a
target="_blank"
href="https://pikwizard.com/photo/creative-light-bulb-maze-for-data-processing-and-analysis/e02f98f951d052ab111d674f4950b6a9/"
style="text-decoration: none; font-size: 10px; margin: 0;"
>
<img src="https://pikwizard.com/pw/medium/e02f98f951d052ab111d674f4950b6a9.jpg" style="margin: 0; width: 100%;" alt="" />
<p style="font-size: 12px; margin: 0;">PikWizard</p>
</a>
</span>
</span>
Free (free of charge)
Free for personal and commercial use.
Author: People Creations