
- Home >
- Stock Photos >
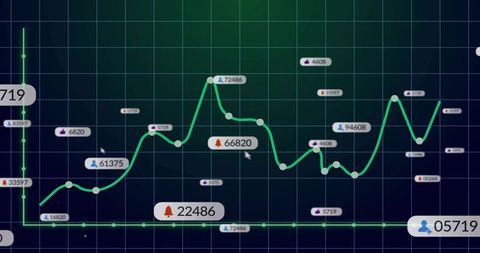
- Cyan Data Stream Visualizing Social Engagement Metrics on Dark Analytics Dashboard
Cyan Data Stream Visualizing Social Engagement Metrics on Dark Analytics Dashboard Image

Featuring dark navy background with cyan and teal dotted data band running horizontally, translucent callouts showing notification, heart, comment, share, and play icons with numeric counters, and subtle numeric overlays adding tech detail. Presenting modern analytics UI composition for showcasing social media performance, user engagement trends, and real-time monitoring. Suited for dashboard mockups, website hero banners, social media marketing materials, blog headers, data-driven presentations, and investor pitch decks. Pairing well with bold sans-serif typography, neon accent colors, and animated overlays for video. Cropping friendly for widescreen banners and full-bleed layouts. Targeting tech startups, marketing agencies, analytics teams, and product managers needing visual assets for reports, case studies, or app mockups.
Powered by  - Get 15% off with code: PIKWIZARD15


downloads
Tags:
More
Credit Photo
If you would like to credit the Photo, here are some ways you can do so
Text Link
photo Link
<span class="text-link">
<span>
<a target="_blank" href=https://pikwizard.com/photo/cyan-data-stream-visualizing-social-engagement-metrics-on-dark-analytics-dashboard/7c81683fa2fbea0ef0ded21aaafb4e78/>PikWizard</a>
</span>
</span>
<span class="image-link">
<span
style="margin: 0 0 20px 0; display: inline-block; vertical-align: middle; width: 100%;"
>
<a
target="_blank"
href="https://pikwizard.com/photo/cyan-data-stream-visualizing-social-engagement-metrics-on-dark-analytics-dashboard/7c81683fa2fbea0ef0ded21aaafb4e78/"
style="text-decoration: none; font-size: 10px; margin: 0;"
>
<img src="https://pikwizard.com/pw/medium/7c81683fa2fbea0ef0ded21aaafb4e78.jpg" style="margin: 0; width: 100%;" alt="" />
<p style="font-size: 12px; margin: 0;">PikWizard</p>
</a>
</span>
</span>
Free (free of charge)
Free for personal and commercial use.
Author: Authentic Images
Similar Free Stock Images

Premium


Premium


Premium


Premium


Premium


Premium


Premium


Premium

Premium


Premium


Premium


Premium


Premium

Premium

Premium


Premium

Premium


Premium


Premium


Premium


Premium


Premium


Premium


Premium


Premium


Explore More Free Stock Images