- Home >
- Stock Photos >
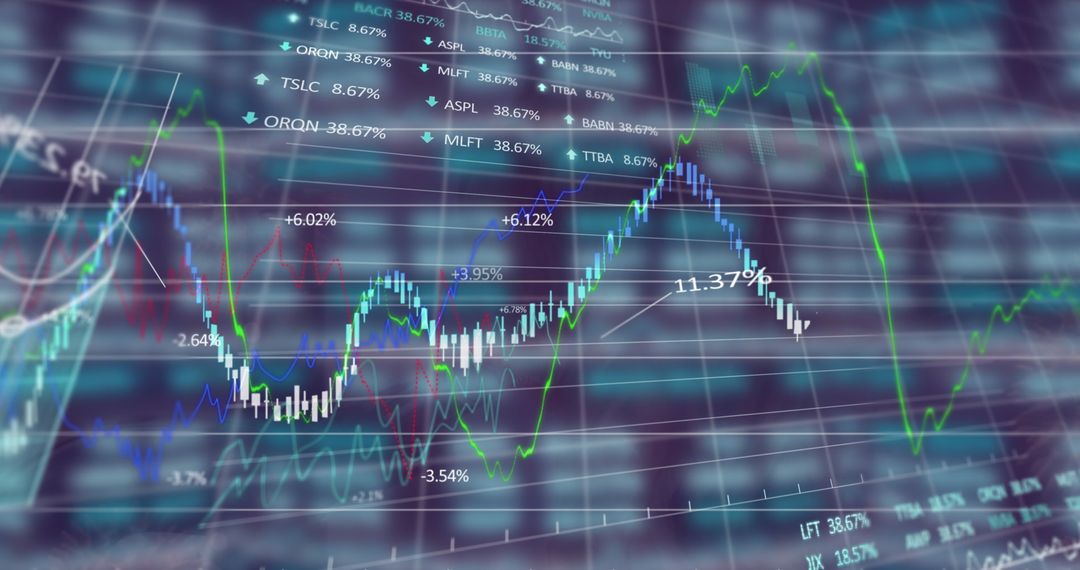
- Cyan Financial Data Dashboard with Rising Trend Line and Futuristic Analytics Interface
Cyan Financial Data Dashboard with Rising Trend Line and Futuristic Analytics Interface Image

Displaying vibrant cyan trend line cutting across layered dashboard panels with numeric readouts, circular gauge, grid overlays, and matrix-style data blocks. Combining sharp geometric frames, translucent layers, and blurred background elements to convey depth and futuristic technology atmosphere. Suiting fintech websites, trading platform landing pages, business intelligence presentations, investor reports, app mockups, and marketing materials. Working well as hero background for finance blogs, slide decks, social media campaigns, video lower-thirds, and HUD overlays. Allowing easy overlay of logos, headlines, KPI numbers due to clear negative space and structured grid composition. Providing visual metaphor for market volatility, growth trends, data-driven decision making, real-time monitoring, and algorithmic trading.
Powered by  - Get 15% off with code: PIKWIZARD15


0
downloads
downloads
Tags:
More
Credit Photo
If you would like to credit the Photo, here are some ways you can do so
Text Link
photo Link
<span class="text-link">
<span>
<a target="_blank" href=https://pikwizard.com/photo/cyan-financial-data-dashboard-with-rising-trend-line-and-futuristic-analytics-interface/b9652f6776392bf8bb831721bbd77159/>PikWizard</a>
</span>
</span>
<span class="image-link">
<span
style="margin: 0 0 20px 0; display: inline-block; vertical-align: middle; width: 100%;"
>
<a
target="_blank"
href="https://pikwizard.com/photo/cyan-financial-data-dashboard-with-rising-trend-line-and-futuristic-analytics-interface/b9652f6776392bf8bb831721bbd77159/"
style="text-decoration: none; font-size: 10px; margin: 0;"
>
<img src="https://pikwizard.com/pw/medium/b9652f6776392bf8bb831721bbd77159.jpg" style="margin: 0; width: 100%;" alt="" />
<p style="font-size: 12px; margin: 0;">PikWizard</p>
</a>
</span>
</span>
Free (free of charge)
Free for personal and commercial use.
Author: Authentic Images
Similar Free Stock Images

Premium


Premium


Premium


Premium


Premium


Premium


Premium


Premium


Premium


Premium


Premium


Premium


Premium


Premium


Premium


Premium


Premium


Premium


Premium


Premium


Premium


Premium


Premium


Premium