
- Home >
- Stock Photos >
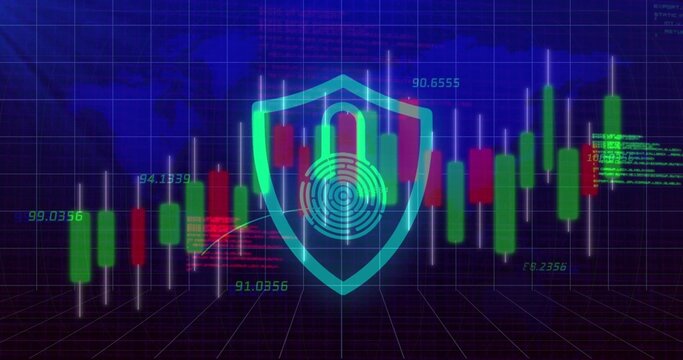
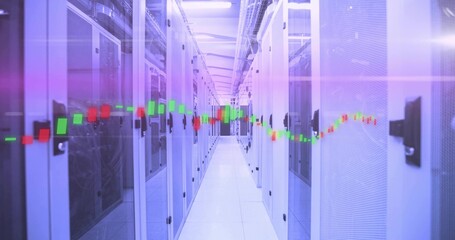
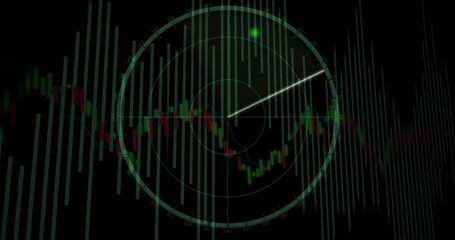
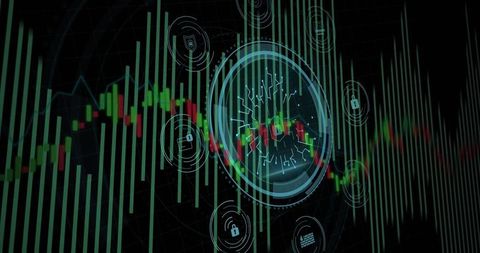
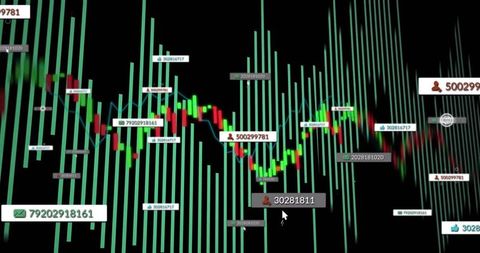
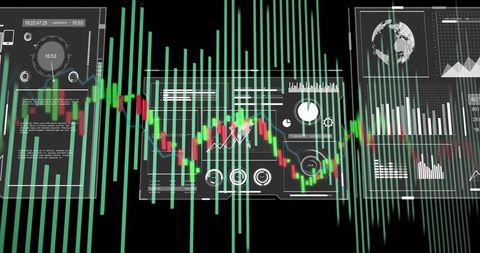
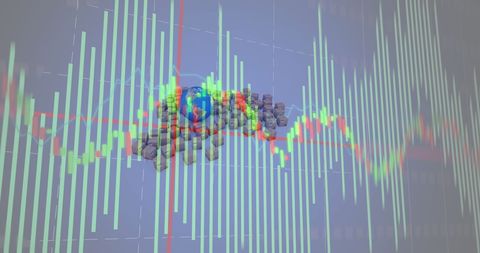
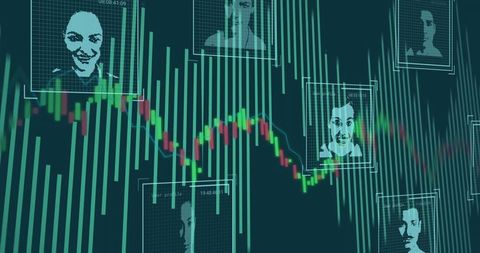
- Cybersecurity with Candlestick Chart and Digital Interface
Cybersecurity with Candlestick Chart and Digital Interface Image

Illustrating digital security through a futuristic dashboard design with prominent candlestick charts and green bars. Reviews of technology often use this visualization, highlighting importance of data analytics and online protection mechanisms. Expedient for presentations on cybersecurity topics, fintech workshops, and solutions focused on safeguarding digital data and technological vulnerabilities.
Powered by 


downloads
Tags:
More
Credit Photo
If you would like to credit the Photo, here are some ways you can do so
Text Link
photo Link
<span class="text-link">
<span>
<a target="_blank" href=https://pikwizard.com/photo/cybersecurity-with-candlestick-chart-and-digital-interface/6a803d5a87dd62d772bfa69fef5707b7/>PikWizard</a>
</span>
</span>
<span class="image-link">
<span
style="margin: 0 0 20px 0; display: inline-block; vertical-align: middle; width: 100%;"
>
<a
target="_blank"
href="https://pikwizard.com/photo/cybersecurity-with-candlestick-chart-and-digital-interface/6a803d5a87dd62d772bfa69fef5707b7/"
style="text-decoration: none; font-size: 10px; margin: 0;"
>
<img src="https://pikwizard.com/pw/medium/6a803d5a87dd62d772bfa69fef5707b7.jpg" style="margin: 0; width: 100%;" alt="" />
<p style="font-size: 12px; margin: 0;">PikWizard</p>
</a>
</span>
</span>
Free (free of charge)
Free for personal and commercial use.
Author: People Creations
Similar Free Stock Images

Premium


Premium

Premium


Premium


Premium
Premium
Premium


Premium


Premium


Explore More Free Stock Images