
- Home >
- Stock Photos >
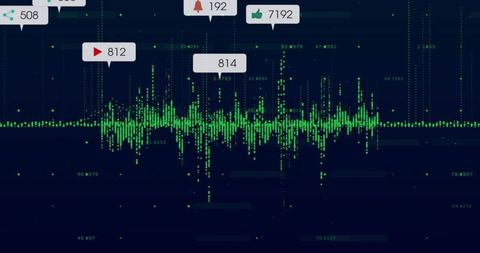
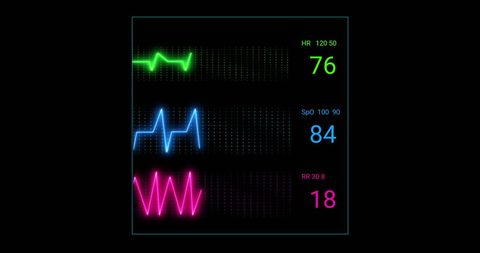
- Dark Tech Waveform with Notification Bubbles for Dashboard Analytics
Dark Tech Waveform with Notification Bubbles for Dashboard Analytics Image

Showing white dotted waveform stretching horizontally across deep navy canvas, punctuated by vertical dotted markers and notification bubbles with numeric counts. Conveying data flow, signal patterns, and live alert activity for modern tech interfaces. Offering ample negative space on left for headline text or UI elements, while right edge contains grouped notification cards for emphasis. Ideal for dashboard headers, website hero banners, app interface mockups, presentation slides, marketing materials, tech blog articles, social media ads. Working well for pitch decks, product demos, data analytics reports, cybersecurity and IoT concepts. Presenting color palette centered on deep blue and white dots with subtle gray accents; easy to recolor to match brand identity. Suggesting cropping for full-width banners, vertical crops for mobile hero layouts, and isolated waveform portions for iconography or background patterns. Recommending overlaying bold headline and CTA on left negative space for high-impact compositions.
Powered by  - Get 15% off with code: PIKWIZARD15


downloads
Tags:
More
Credit Photo
If you would like to credit the Photo, here are some ways you can do so
Text Link
photo Link
<span class="text-link">
<span>
<a target="_blank" href=https://pikwizard.com/photo/dark-tech-waveform-with-notification-bubbles-for-dashboard-analytics/da5d80d83822d63422ba1f8ceb411c76/>PikWizard</a>
</span>
</span>
<span class="image-link">
<span
style="margin: 0 0 20px 0; display: inline-block; vertical-align: middle; width: 100%;"
>
<a
target="_blank"
href="https://pikwizard.com/photo/dark-tech-waveform-with-notification-bubbles-for-dashboard-analytics/da5d80d83822d63422ba1f8ceb411c76/"
style="text-decoration: none; font-size: 10px; margin: 0;"
>
<img src="https://pikwizard.com/pw/medium/da5d80d83822d63422ba1f8ceb411c76.jpg" style="margin: 0; width: 100%;" alt="" />
<p style="font-size: 12px; margin: 0;">PikWizard</p>
</a>
</span>
</span>
Free (free of charge)
Free for personal and commercial use.
Author: Awesome Content
Similar Free Stock Images

Premium


Premium

Premium


Premium


Premium


Premium


Premium


Premium

Premium

Premium

Premium


Premium


Premium


Premium

Premium


Premium


Premium


Premium


Premium


Premium

Premium


Premium


Premium

Premium


Premium

Explore More Free Stock Images