- Home >
- Stock Photos >
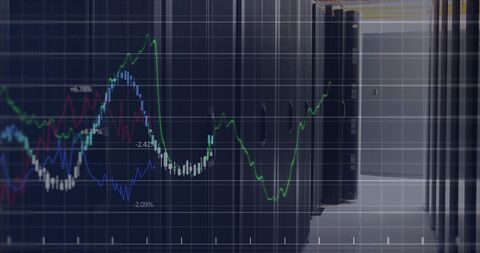
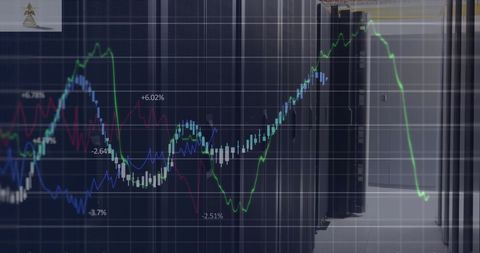
- Data Processing and Statistics Visualization in Server Room
Data Processing and Statistics Visualization in Server Room Image

Graph lines and data numbers overlay server room, illustrating data analysis and technological operations. Useful for representing cloud computing technology, cybersecurity solutions, IT infrastructure development, and network data processing. Ideal for articles or content about data science, digital transformation, and advanced networking systems.

downloads
Tags:
More
Credit Photo
If you would like to credit the Photo, here are some ways you can do so
Text Link
photo Link
<span class="text-link">
<span>
<a target="_blank" href=https://pikwizard.com/photo/data-processing-and-statistics-visualization-in-server-room/583f4cdb4f3eca68557c5f8c06b1155c/>PikWizard</a>
</span>
</span>
<span class="image-link">
<span
style="margin: 0 0 20px 0; display: inline-block; vertical-align: middle; width: 100%;"
>
<a
target="_blank"
href="https://pikwizard.com/photo/data-processing-and-statistics-visualization-in-server-room/583f4cdb4f3eca68557c5f8c06b1155c/"
style="text-decoration: none; font-size: 10px; margin: 0;"
>
<img src="https://pikwizard.com/pw/medium/583f4cdb4f3eca68557c5f8c06b1155c.jpg" style="margin: 0; width: 100%;" alt="" />
<p style="font-size: 12px; margin: 0;">PikWizard</p>
</a>
</span>
</span>
Free (free of charge)
Free for personal and commercial use.
Author: Creative Art