- Home >
- Stock Photos >
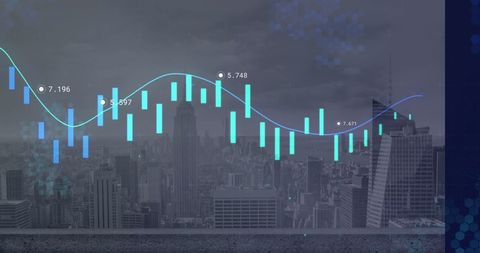
- Data Processing Visualization with Cityscape Background
Data Processing Visualization with Cityscape Background Image

Digitally generated visual showing financial data processing with city skyline. Ideal for illustrating economic trends, technology impacts on modern cities, or presentations on finance and data analysis. Useful for websites, business reports, and educational materials that focus on urban economic landscapes and digital transformation.

downloads
Tags:
More
Credit Photo
If you would like to credit the Photo, here are some ways you can do so
Text Link
photo Link
<span class="text-link">
<span>
<a target="_blank" href=https://pikwizard.com/photo/data-processing-visualization-with-cityscape-background/18146ae83ed8d2ab4dd17d712d9f5013/>PikWizard</a>
</span>
</span>
<span class="image-link">
<span
style="margin: 0 0 20px 0; display: inline-block; vertical-align: middle; width: 100%;"
>
<a
target="_blank"
href="https://pikwizard.com/photo/data-processing-visualization-with-cityscape-background/18146ae83ed8d2ab4dd17d712d9f5013/"
style="text-decoration: none; font-size: 10px; margin: 0;"
>
<img src="https://pikwizard.com/pw/medium/18146ae83ed8d2ab4dd17d712d9f5013.jpg" style="margin: 0; width: 100%;" alt="" />
<p style="font-size: 12px; margin: 0;">PikWizard</p>
</a>
</span>
</span>
Free (free of charge)
Free for personal and commercial use.
Author: People Creations