
- Home >
- Stock Photos >
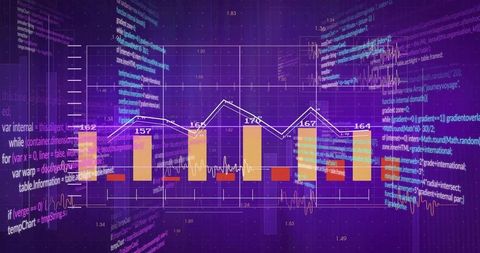
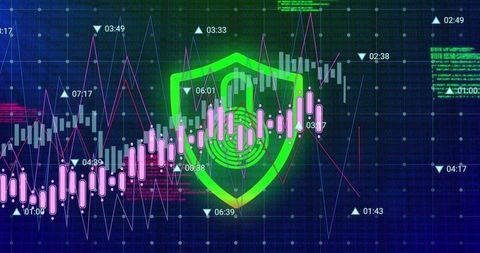
- Data Visualization Merging Cyber Security Code Elements with Analytics Graphs
Data Visualization Merging Cyber Security Code Elements with Analytics Graphs Image
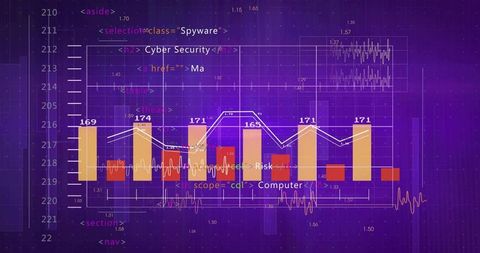
Abstract combination of analytics with cybersecurity themed code provides insight into data-driven visuals used in technical UI design. Key colors highlight stats and graphs useful in technology and graphics materials including presentations on information technology or emphasizing IT-experience-centric heavy software.
Powered by  - Get 15% off with code: PIKWIZARD15


downloads
Tags:
More
Credit Photo
If you would like to credit the Photo, here are some ways you can do so
Text Link
photo Link
<span class="text-link">
<span>
<a target="_blank" href=https://pikwizard.com/photo/data-visualization-merging-cyber-security-code-elements-with-analytics-graphs/c74ec43ad41b93de2a4b023de15a6790/>PikWizard</a>
</span>
</span>
<span class="image-link">
<span
style="margin: 0 0 20px 0; display: inline-block; vertical-align: middle; width: 100%;"
>
<a
target="_blank"
href="https://pikwizard.com/photo/data-visualization-merging-cyber-security-code-elements-with-analytics-graphs/c74ec43ad41b93de2a4b023de15a6790/"
style="text-decoration: none; font-size: 10px; margin: 0;"
>
<img src="https://pikwizard.com/pw/medium/c74ec43ad41b93de2a4b023de15a6790.jpg" style="margin: 0; width: 100%;" alt="" />
<p style="font-size: 12px; margin: 0;">PikWizard</p>
</a>
</span>
</span>
Free (free of charge)
Free for personal and commercial use.
Author: Creative Art
Similar Free Stock Images

Premium


Premium


Premium


Premium


Premium

Premium


Premium


Premium


Premium


Premium

Premium

Premium


Premium


Premium


Premium

Premium


Premium


Premium


Premium

Premium


Premium

Premium


Premium


Premium


Premium

Explore More Free Stock Images