- Home >
- Stock Photos >
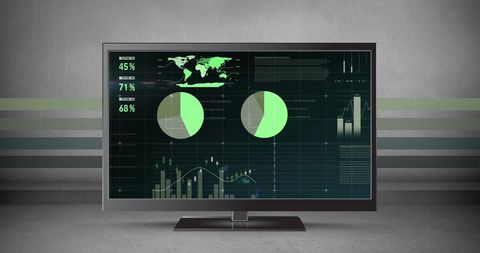
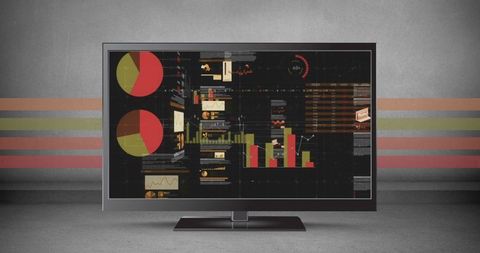
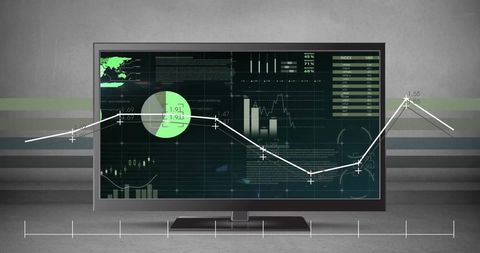
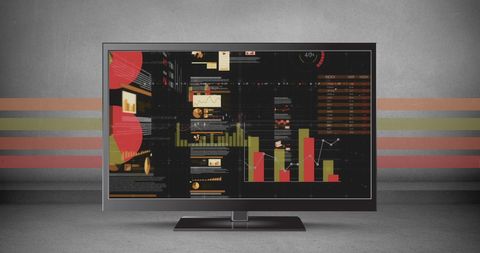
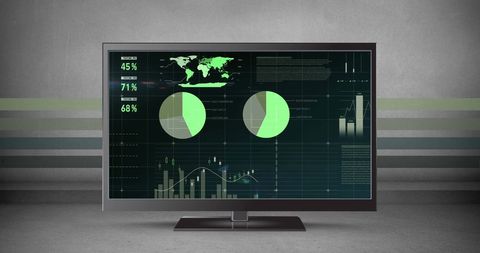
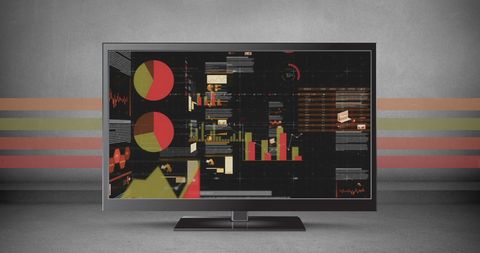
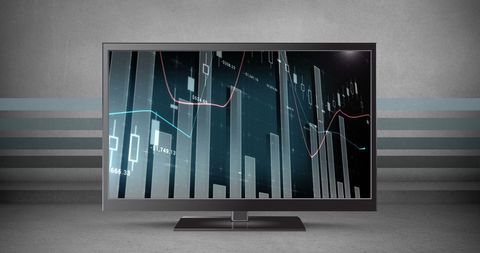
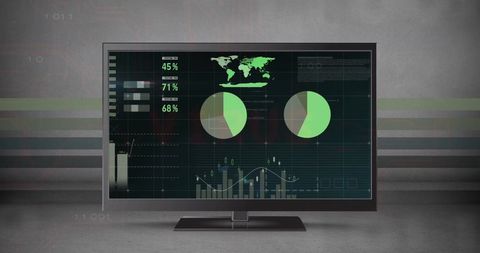
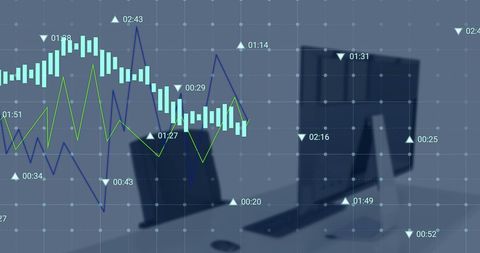
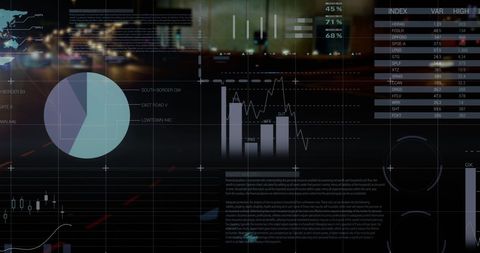
- Data Visualization on Digital Interface Screen
Data Visualization on Digital Interface Screen Image
Complex graphs with dynamic data displayed on a digital interface screen illustrate the concept of modern business analytics. The image includes colorful charts and statistical elements, showcasing the process of data-driven decision-making. Useful for presentations on finance, data science, or corporate strategy discussions. Highlights the technological aspect of analyzing and interpreting large datasets.

downloads
Tags:
More
Credit Photo
If you would like to credit the Photo, here are some ways you can do so
Text Link
photo Link
<span class="text-link">
<span>
<a target="_blank" href=https://pikwizard.com/photo/data-visualization-on-digital-interface-screen/a8b47a5bc9d07395e097414d272bde76/>PikWizard</a>
</span>
</span>
<span class="image-link">
<span
style="margin: 0 0 20px 0; display: inline-block; vertical-align: middle; width: 100%;"
>
<a
target="_blank"
href="https://pikwizard.com/photo/data-visualization-on-digital-interface-screen/a8b47a5bc9d07395e097414d272bde76/"
style="text-decoration: none; font-size: 10px; margin: 0;"
>
<img src="https://pikwizard.com/pw/medium/a8b47a5bc9d07395e097414d272bde76.jpg" style="margin: 0; width: 100%;" alt="" />
<p style="font-size: 12px; margin: 0;">PikWizard</p>
</a>
</span>
</span>
Free (free of charge)
Free for personal and commercial use.
Author: Authentic Images