- Home >
- Stock Photos >
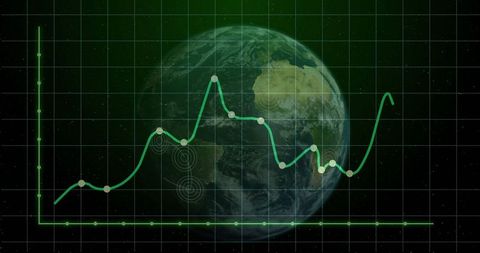
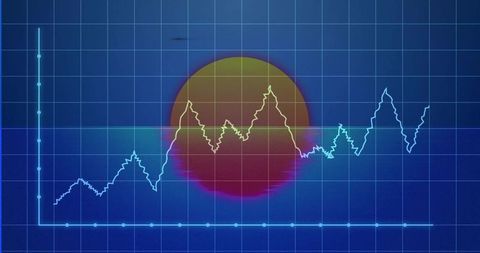
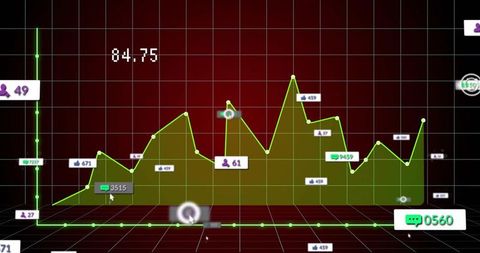
- Data Visualization with Graph and Globe for Business Analytics
Data Visualization with Graph and Globe for Business Analytics Image

Scene shows modern data visualization concepts with graph overlaid on globe, ideal for presentations on global market trends and technology. Suitable for illustrating articles on the integration of data analytics in business or tracking global metrics using digital dashboards.
Powered by 


downloads
Tags:
More
Credit Photo
If you would like to credit the Photo, here are some ways you can do so
Text Link
photo Link
<span class="text-link">
<span>
<a target="_blank" href=https://pikwizard.com/photo/data-visualization-with-graph-and-globe-for-business-analytics/a206e0279b81c4b0eb440db2a8216fa9/>PikWizard</a>
</span>
</span>
<span class="image-link">
<span
style="margin: 0 0 20px 0; display: inline-block; vertical-align: middle; width: 100%;"
>
<a
target="_blank"
href="https://pikwizard.com/photo/data-visualization-with-graph-and-globe-for-business-analytics/a206e0279b81c4b0eb440db2a8216fa9/"
style="text-decoration: none; font-size: 10px; margin: 0;"
>
<img src="https://pikwizard.com/pw/medium/a206e0279b81c4b0eb440db2a8216fa9.jpg" style="margin: 0; width: 100%;" alt="" />
<p style="font-size: 12px; margin: 0;">PikWizard</p>
</a>
</span>
</span>
Free (free of charge)
Free for personal and commercial use.
Author: Authentic Images