
- Home >
- Stock Photos >
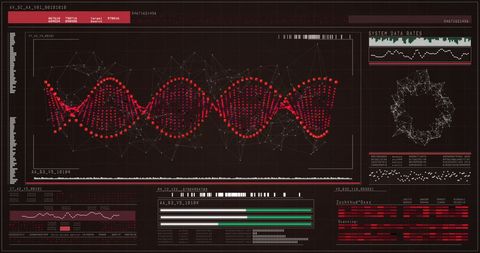
- Data Visualization with Line Charts and Cyberspace Interface
Data Visualization with Line Charts and Cyberspace Interface Image

Innovative tool for professionals seeking comprehensive visual data representation. Essential for data scientists exploring cybersecurity, analysts assessing performance trends. Use as thematic background for digital forums or presentations focused on technology advancements.
Powered by 


downloads
Tags:
More
Credit Photo
If you would like to credit the Photo, here are some ways you can do so
Text Link
photo Link
<span class="text-link">
<span>
<a target="_blank" href=https://pikwizard.com/photo/data-visualization-with-line-charts-and-cyberspace-interface/1213725cbb04bf935298d7bfe3cad1f5/>PikWizard</a>
</span>
</span>
<span class="image-link">
<span
style="margin: 0 0 20px 0; display: inline-block; vertical-align: middle; width: 100%;"
>
<a
target="_blank"
href="https://pikwizard.com/photo/data-visualization-with-line-charts-and-cyberspace-interface/1213725cbb04bf935298d7bfe3cad1f5/"
style="text-decoration: none; font-size: 10px; margin: 0;"
>
<img src="https://pikwizard.com/pw/medium/1213725cbb04bf935298d7bfe3cad1f5.jpg" style="margin: 0; width: 100%;" alt="" />
<p style="font-size: 12px; margin: 0;">PikWizard</p>
</a>
</span>
</span>
Free (free of charge)
Free for personal and commercial use.
Author: Authentic Images
Similar Free Stock Images

Premium


Premium


Premium


Premium


Premium


Premium


Premium


Premium

Premium


Premium


Premium


Premium


Premium


Premium

Premium


Premium

Premium


Premium


Premium


Premium


Premium


Premium


Premium


Premium


Premium


Explore More Free Stock Images