
- Home >
- Stock Photos >
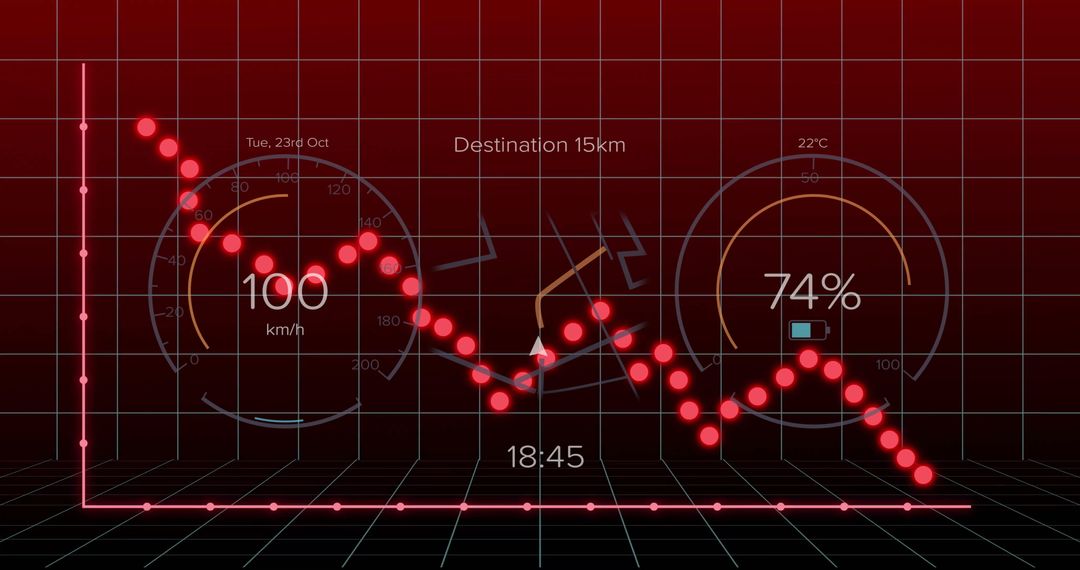
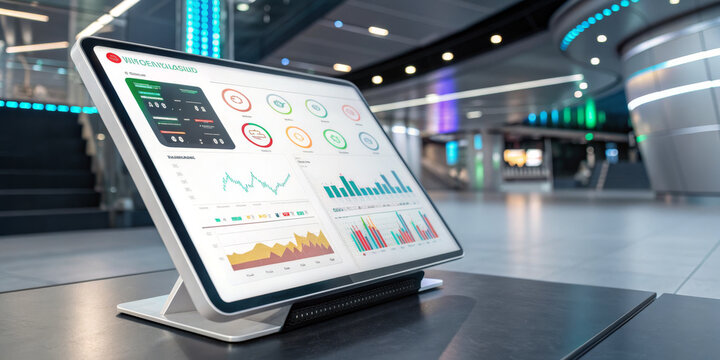
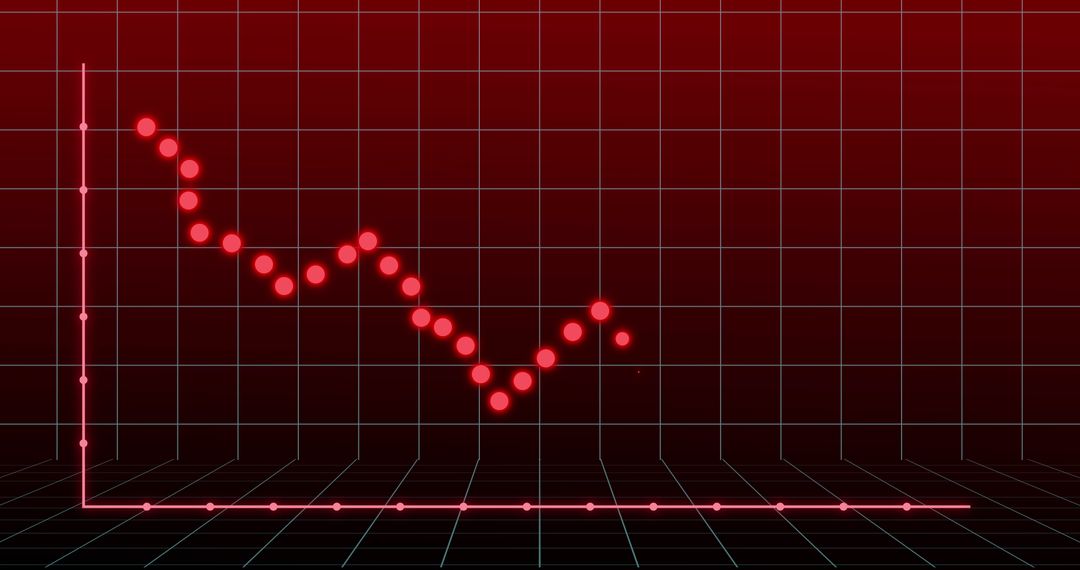
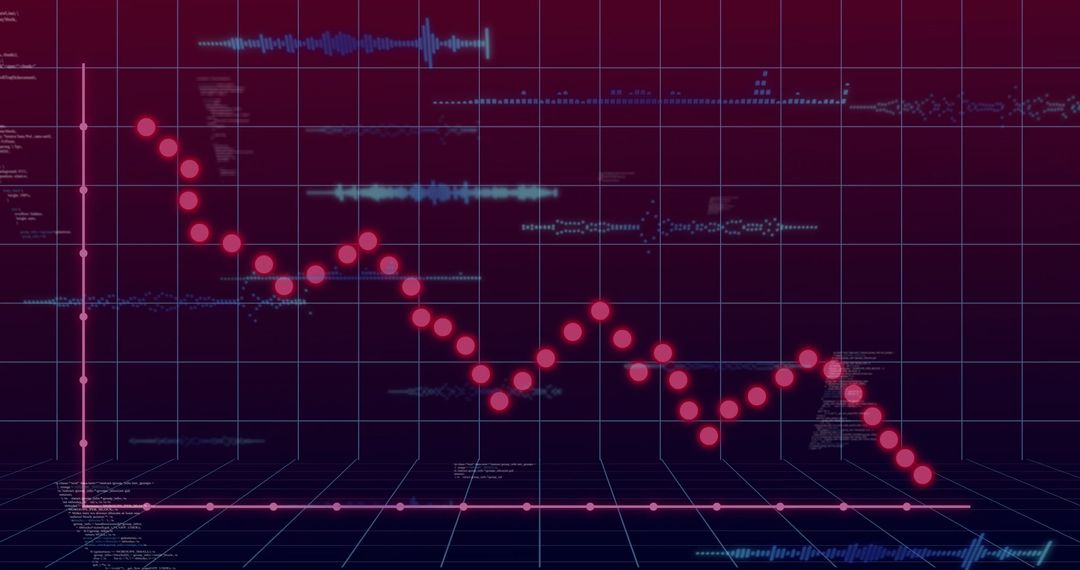
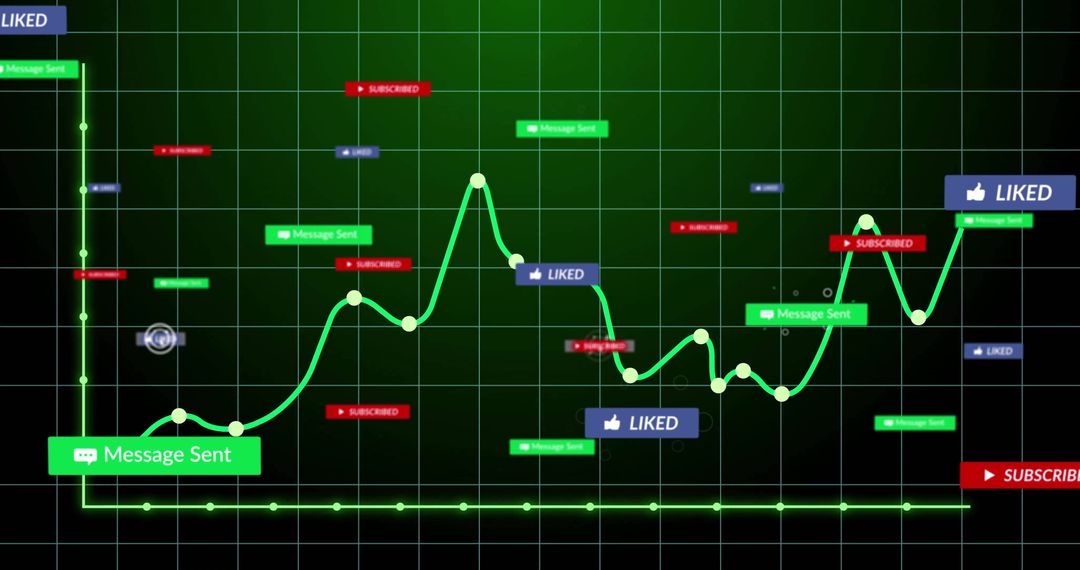
- Descending Data Trend Line on Futuristic Digital Dashboard
Descending Data Trend Line on Futuristic Digital Dashboard Image

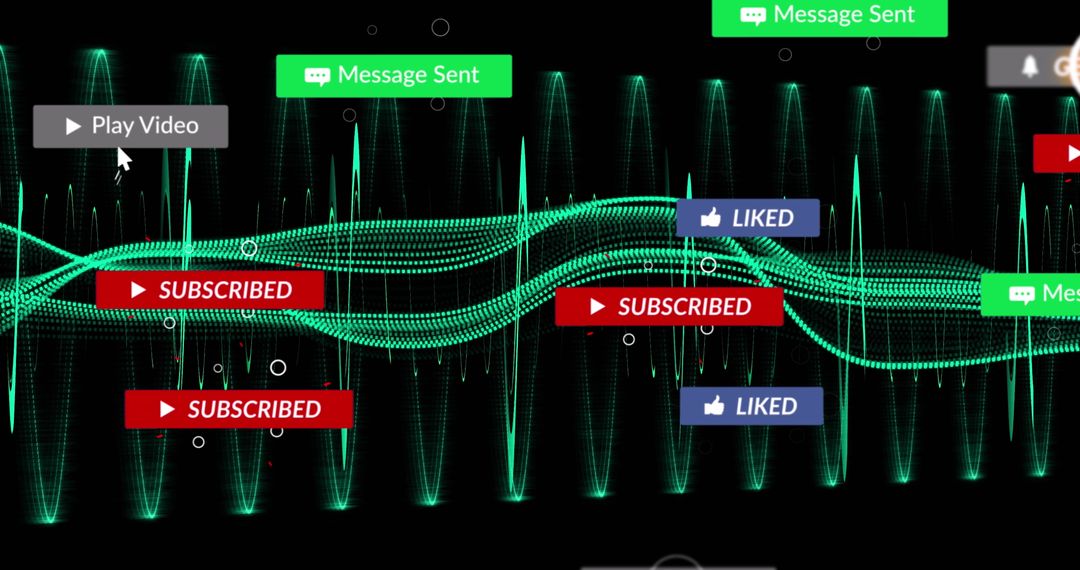
This illustration shows a glowing data trend line descending across a futuristic analytics dashboard. Representation includes notification labels such as liked, friend added, video playing, suggesting interaction tracking features. It is useful for presentations about digital platform analytics, marketing strategies, technological innovation, and educational materials on data visualization and analysis.
Powered by 


0
downloads
downloads
Tags:
More
Credit Photo
If you would like to credit the Photo, here are some ways you can do so
Text Link
photo Link
<span class="text-link">
<span>
<a target="_blank" href=https://pikwizard.com/photo/descending-data-trend-line-on-futuristic-digital-dashboard/41eca61165e2f8b957cc28880cbd5e20/>PikWizard</a>
</span>
</span>
<span class="image-link">
<span
style="margin: 0 0 20px 0; display: inline-block; vertical-align: middle; width: 100%;"
>
<a
target="_blank"
href="https://pikwizard.com/photo/descending-data-trend-line-on-futuristic-digital-dashboard/41eca61165e2f8b957cc28880cbd5e20/"
style="text-decoration: none; font-size: 10px; margin: 0;"
>
<img src="https://pikwizard.com/pw/medium/41eca61165e2f8b957cc28880cbd5e20.jpg" style="margin: 0; width: 100%;" alt="" />
<p style="font-size: 12px; margin: 0;">PikWizard</p>
</a>
</span>
</span>
Free (free of charge)
Free for personal and commercial use.
Author: Awesome Content
Similar Free Stock Images

Premium


Premium


Premium


Premium


Premium


Premium


Premium


Premium


Premium


Premium


Premium


Premium


Premium


Premium


Premium


Premium


Premium


Premium


Premium


Premium


Premium


Premium


Premium


Premium

