- Home >
- Stock Photos >
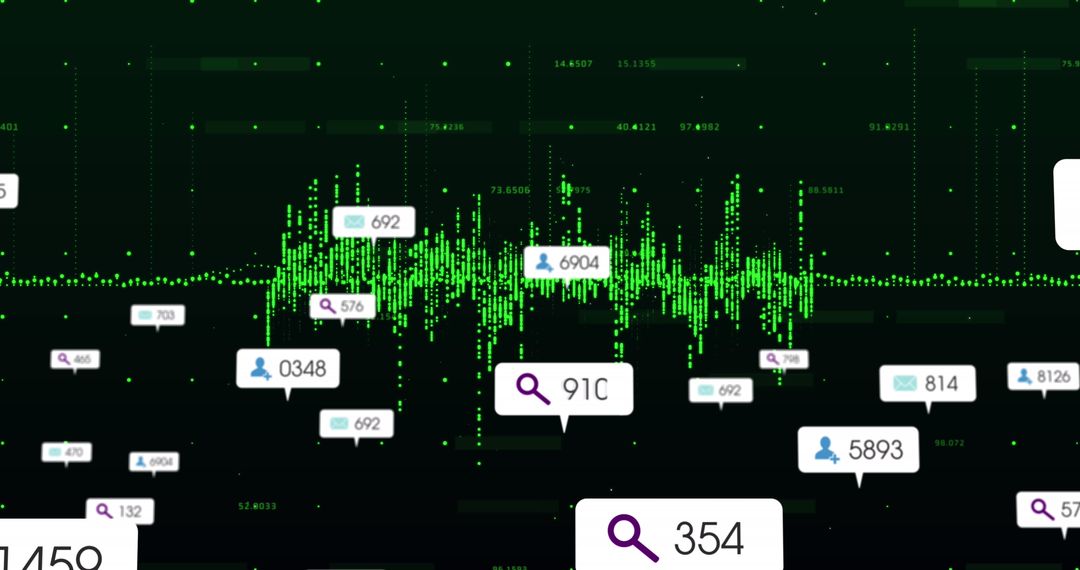
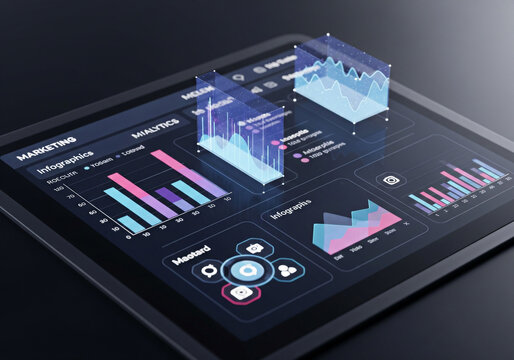
- Digital Analytics Dashboard with Social Media Metrics and Visualization
Digital Analytics Dashboard with Social Media Metrics and Visualization Image

Dynamic depiction of a digital dashboard presenting social media metrics and user interactions on an engaging and intuitive interface. Turquoise points showcase data trends while line graphs indicate measure fluctuations over time. Useful for illustrating concepts of data-driven business strategies, informational displays, tech-driven market research, and business intelligence applications. Ideal for presentations, articles on analytics, as well as educational materials on user interface design.
Powered by 


0
downloads
downloads
Tags:
More
Credit Photo
If you would like to credit the Photo, here are some ways you can do so
Text Link
photo Link
<span class="text-link">
<span>
<a target="_blank" href=https://pikwizard.com/photo/digital-analytics-dashboard-with-social-media-metrics-and-visualization/41d1a3ebd957597aff28a20304902aaa/>PikWizard</a>
</span>
</span>
<span class="image-link">
<span
style="margin: 0 0 20px 0; display: inline-block; vertical-align: middle; width: 100%;"
>
<a
target="_blank"
href="https://pikwizard.com/photo/digital-analytics-dashboard-with-social-media-metrics-and-visualization/41d1a3ebd957597aff28a20304902aaa/"
style="text-decoration: none; font-size: 10px; margin: 0;"
>
<img src="https://pikwizard.com/pw/medium/41d1a3ebd957597aff28a20304902aaa.jpg" style="margin: 0; width: 100%;" alt="" />
<p style="font-size: 12px; margin: 0;">PikWizard</p>
</a>
</span>
</span>
Free (free of charge)
Free for personal and commercial use.
Author: Authentic Images
Similar Free Stock Images

Premium


Premium


Premium


Premium


Premium


Premium


Premium


Premium


Premium


Premium


Premium


Premium


Premium


Premium


Premium


Premium


Premium


Premium


Premium


Premium


Premium


Premium


Premium


Premium