
- Home >
- Stock Photos >
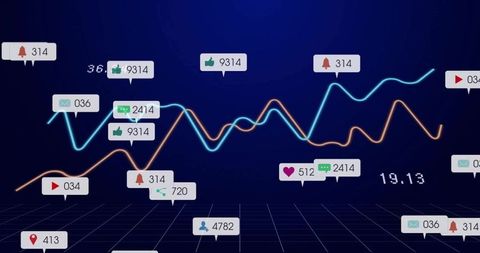
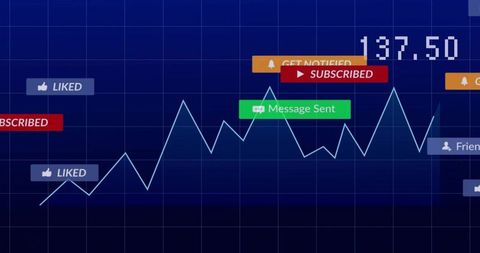
- Digital Analytics Graph with Futuristic 3D Interface
Digital Analytics Graph with Futuristic 3D Interface Image

A visually striking representation of interactive digital analytics using oscillating red and blue line graphs on a 3D grid. This image features conversational tags like 'Liked' and 'Subscribed', indicative of social media interactions. Perfect for illustrating concepts of growth, innovation, and data-driven insights in media, tech conferences, and business presentations.
Powered by 


downloads
Tags:
More
Credit Photo
If you would like to credit the Photo, here are some ways you can do so
Text Link
photo Link
<span class="text-link">
<span>
<a target="_blank" href=https://pikwizard.com/photo/digital-analytics-graph-with-futuristic-3d-interface/d59eefc88fa8518ff01d52b259004142/>PikWizard</a>
</span>
</span>
<span class="image-link">
<span
style="margin: 0 0 20px 0; display: inline-block; vertical-align: middle; width: 100%;"
>
<a
target="_blank"
href="https://pikwizard.com/photo/digital-analytics-graph-with-futuristic-3d-interface/d59eefc88fa8518ff01d52b259004142/"
style="text-decoration: none; font-size: 10px; margin: 0;"
>
<img src="https://pikwizard.com/pw/medium/d59eefc88fa8518ff01d52b259004142.jpg" style="margin: 0; width: 100%;" alt="" />
<p style="font-size: 12px; margin: 0;">PikWizard</p>
</a>
</span>
</span>
Free (free of charge)
Free for personal and commercial use.
Author: People Creations
Similar Free Stock Images

Premium


Premium


Premium

Premium


Premium


Premium


Premium


Premium


Premium

Premium


Premium


Premium


Premium


Premium


Premium


Premium


Premium


Premium


Premium


Premium

Premium

Premium


Premium


Premium


Premium


Explore More Free Stock Images