- Home >
- Stock Photos >
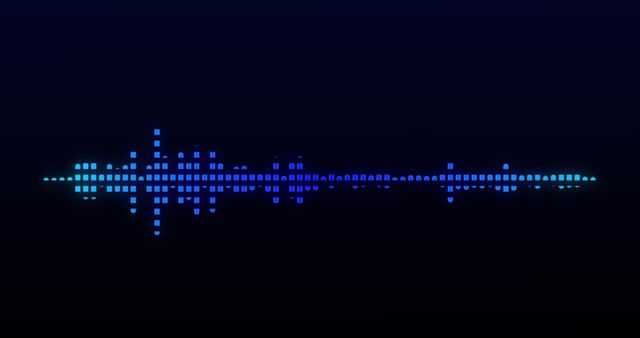
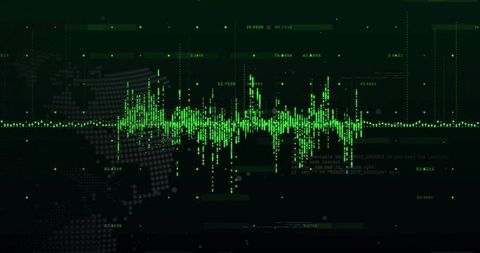
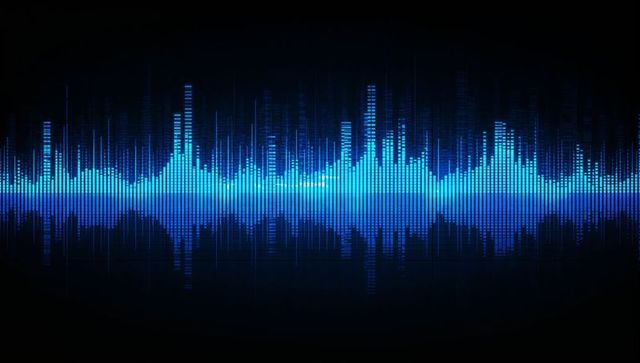
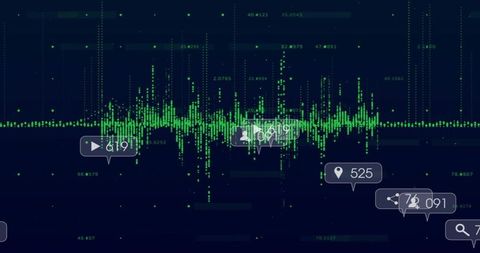
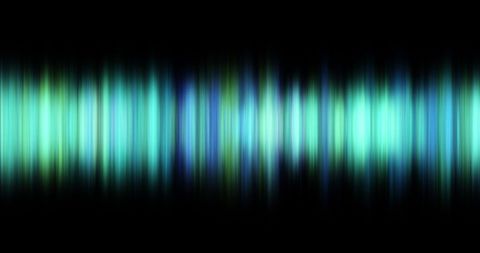
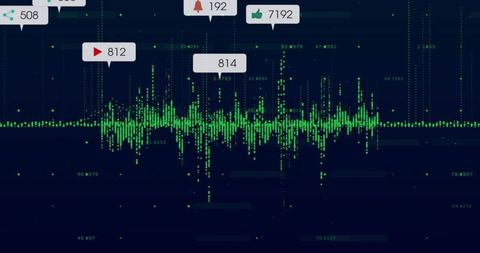
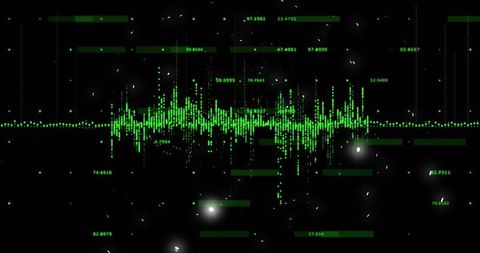
- Digital Audiovisual Equalizer Waves on Dark Background
Digital Audiovisual Equalizer Waves on Dark Background Image
AI
AI Generated Image. Digital audio equalizer waves create a vibrant visual display against a dark background. The electronic design with mirrored reflections of the bars captures the essence of sound and music, making it ideal for themes related to music production, audio technology, or futuristic interfaces. Perfect for integrating into presentations, music apps, or technology-themed posters.
Powered by  - Get 15% off with code: PIKWIZARD15


downloads
Tags:
More
Credit Photo
If you would like to credit the Photo, here are some ways you can do so
Text Link
photo Link
<span class="text-link">
<span>
<a target="_blank" href=https://pikwizard.com/photo/digital-audiovisual-equalizer-waves-on-dark-background/852f014771659ad52e746f687795a443/>PikWizard</a>
</span>
</span>
<span class="image-link">
<span
style="margin: 0 0 20px 0; display: inline-block; vertical-align: middle; width: 100%;"
>
<a
target="_blank"
href="https://pikwizard.com/photo/digital-audiovisual-equalizer-waves-on-dark-background/852f014771659ad52e746f687795a443/"
style="text-decoration: none; font-size: 10px; margin: 0;"
>
<img src="https://pikwizard.com/pw/medium/852f014771659ad52e746f687795a443.jpg" style="margin: 0; width: 100%;" alt="" />
<p style="font-size: 12px; margin: 0;">PikWizard</p>
</a>
</span>
</span>
Free (free of charge)
Free for personal and commercial use.
Author: AI Creator
Similar Free Stock Images
Loading...
Premium


Premium

Premium

Premium

Premium


Premium


Premium


Premium

Premium

Premium


Premium