
- Home >
- Stock Photos >
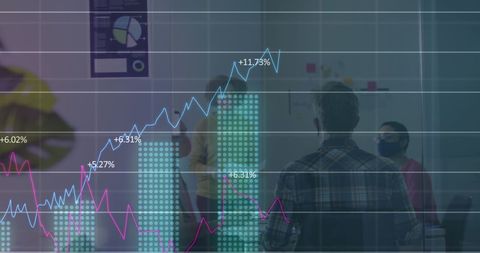
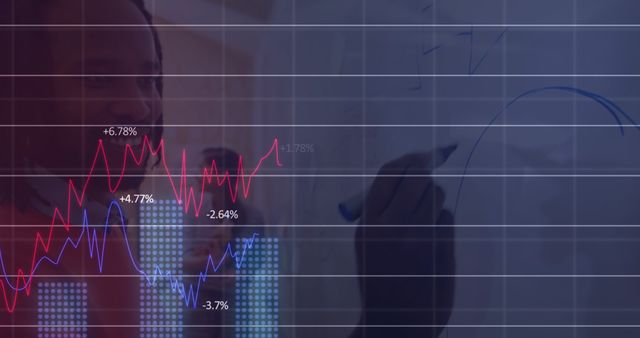
- Digital Business Analysis with Graphs and Data Visualization
Digital Business Analysis with Graphs and Data Visualization Image

Designed for business presentations and reports, this depicts financial data analysis combined with digital processing elements. Vibrant graphical curves and charts convey growth and dynamic market trends, ideal for illustrating concepts such as business intelligence, financial forecasting, and modern technology usage in global business contexts.
Powered by  - Get 15% off with code: PIKWIZARD15


downloads
Tags:
More
Credit Photo
If you would like to credit the Photo, here are some ways you can do so
Text Link
photo Link
<span class="text-link">
<span>
<a target="_blank" href=https://pikwizard.com/photo/digital-business-analysis-with-graphs-and-data-visualization/b9b9b634f275a8d31b0e6a4d13287765/>PikWizard</a>
</span>
</span>
<span class="image-link">
<span
style="margin: 0 0 20px 0; display: inline-block; vertical-align: middle; width: 100%;"
>
<a
target="_blank"
href="https://pikwizard.com/photo/digital-business-analysis-with-graphs-and-data-visualization/b9b9b634f275a8d31b0e6a4d13287765/"
style="text-decoration: none; font-size: 10px; margin: 0;"
>
<img src="https://pikwizard.com/pw/medium/b9b9b634f275a8d31b0e6a4d13287765.jpg" style="margin: 0; width: 100%;" alt="" />
<p style="font-size: 12px; margin: 0;">PikWizard</p>
</a>
</span>
</span>
Free (free of charge)
Free for personal and commercial use.
Author: Authentic Images
Similar Free Stock Images

Premium


Premium


Premium


Premium


Premium


Premium


Premium

Premium

Premium


Premium


Premium

Premium

Premium


Premium


Premium


Premium

Premium


Premium


Premium


Premium


Premium


Premium


Premium


Premium


Premium


Explore More Free Stock Images