
- Home >
- Stock Photos >
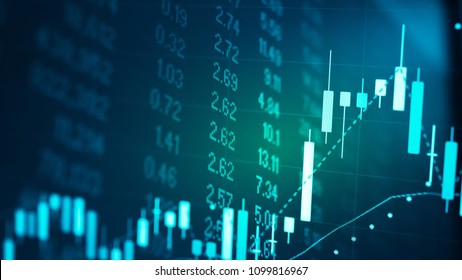
- Digital Candlestick Chart with Percentages and Analytics Lines
Digital Candlestick Chart with Percentages and Analytics Lines Image

This chart showcases complex financial data visualized in the form of candlesticks and analytical lines, emphasizing readable percentage points and wavy background patterns. Ideal for use in financial reports, investment blogs, technology presentations, or analytical software, emphasizing modern digital finance and data interpretation.
Powered by  - Get 15% off with code: PIKWIZARD15


0
downloads
downloads
Tags:
More
Credit Photo
If you would like to credit the Photo, here are some ways you can do so
Text Link
photo Link
<span class="text-link">
<span>
<a target="_blank" href=https://pikwizard.com/photo/digital-candlestick-chart-with-percentages-and-analytics-lines/9cff82f96df3b8b0f4ad57da6a929dba/>PikWizard</a>
</span>
</span>
<span class="image-link">
<span
style="margin: 0 0 20px 0; display: inline-block; vertical-align: middle; width: 100%;"
>
<a
target="_blank"
href="https://pikwizard.com/photo/digital-candlestick-chart-with-percentages-and-analytics-lines/9cff82f96df3b8b0f4ad57da6a929dba/"
style="text-decoration: none; font-size: 10px; margin: 0;"
>
<img src="https://pikwizard.com/pw/medium/9cff82f96df3b8b0f4ad57da6a929dba.jpg" style="margin: 0; width: 100%;" alt="" />
<p style="font-size: 12px; margin: 0;">PikWizard</p>
</a>
</span>
</span>
Free (free of charge)
Free for personal and commercial use.
Author: People Creations
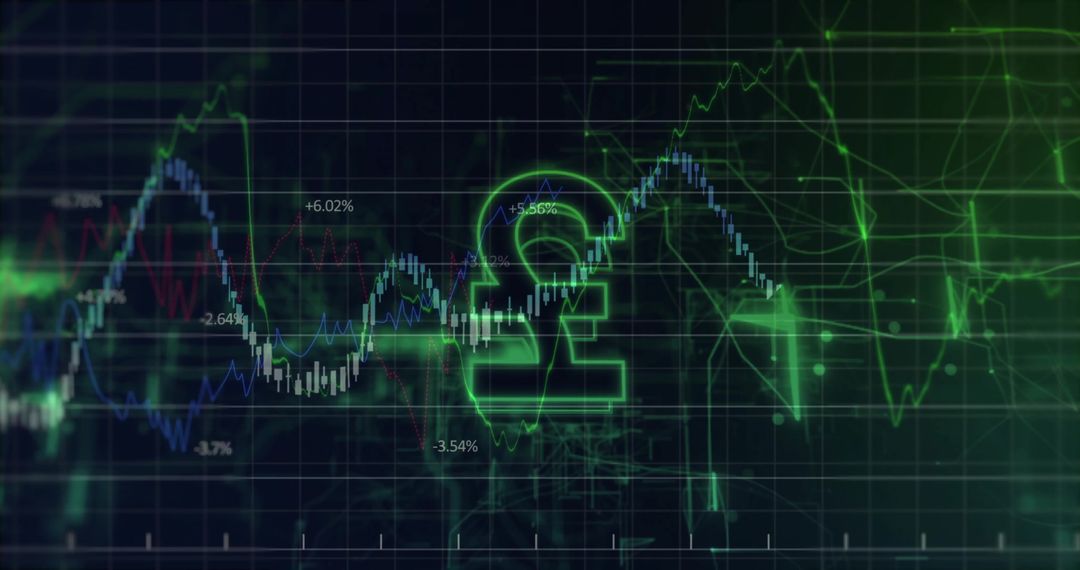
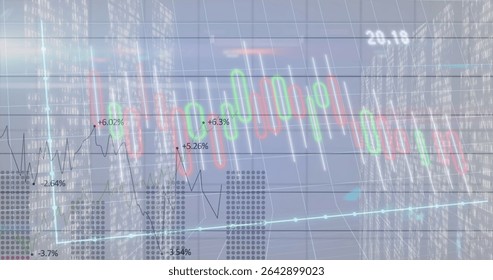
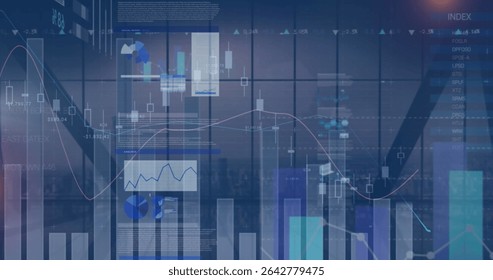
Similar Free Stock Images

Premium


Premium


Premium


Premium


Premium


Premium


Premium


Premium


Premium


Premium


Premium


Premium


Premium


Premium


Premium


Premium


Premium


Premium


Premium


Premium


Premium


Premium


Premium


Premium

