
- Home >
- Stock Photos >
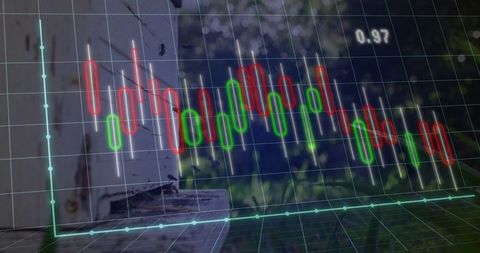
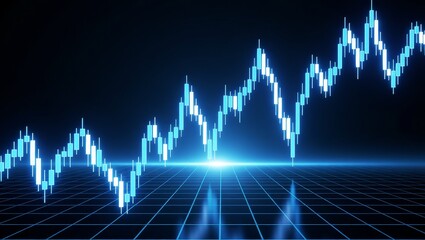
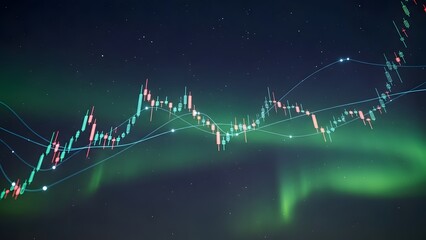
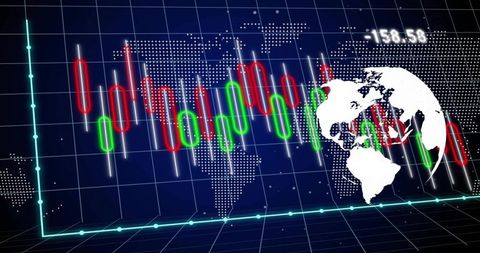
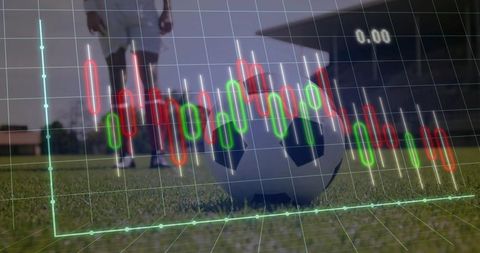
- Digital Candlestick Chart with Wireframe Globe in Modern Analytics Visualization
Digital Candlestick Chart with Wireframe Globe in Modern Analytics Visualization Image
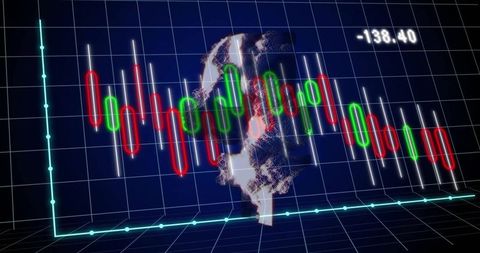
Illustrates abstract and modern financial data visualization with a combination of red and green candlestick charts amidst a wireframe globe. Ideal for illustrating financial analytics, stock market trends, and technological advances in trading platforms. Suitable for finance and tech-related content, presentations, and educational materials emphasizing data analysis and global economic trends.
Powered by 


downloads
Tags:
More
Credit Photo
If you would like to credit the Photo, here are some ways you can do so
Text Link
photo Link
<span class="text-link">
<span>
<a target="_blank" href=https://pikwizard.com/photo/digital-candlestick-chart-with-wireframe-globe-in-modern-analytics-visualization/a083b1b561a13d8d94791d861dbb01a3/>PikWizard</a>
</span>
</span>
<span class="image-link">
<span
style="margin: 0 0 20px 0; display: inline-block; vertical-align: middle; width: 100%;"
>
<a
target="_blank"
href="https://pikwizard.com/photo/digital-candlestick-chart-with-wireframe-globe-in-modern-analytics-visualization/a083b1b561a13d8d94791d861dbb01a3/"
style="text-decoration: none; font-size: 10px; margin: 0;"
>
<img src="https://pikwizard.com/pw/medium/a083b1b561a13d8d94791d861dbb01a3.jpg" style="margin: 0; width: 100%;" alt="" />
<p style="font-size: 12px; margin: 0;">PikWizard</p>
</a>
</span>
</span>
Free (free of charge)
Free for personal and commercial use.
Author: Awesome Content
Similar Free Stock Images

Premium

Premium

Premium


Premium


AI

Premium


Premium


Premium


Premium


Premium


Premium


Premium


Premium


Premium


Premium


Premium

Premium


Premium


Premium


Premium


Premium


Premium


Premium


Premium


Premium


Premium

Explore More Free Stock Images