
- Home >
- Free Stock Photos & Images >
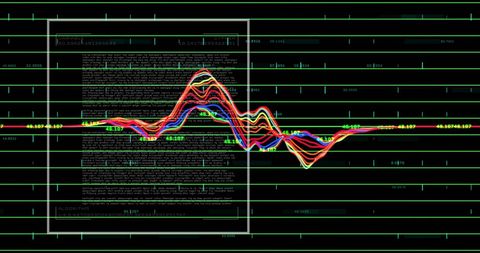
- Digital Code Visualization on Grid Background Representing Data Processing
Digital Code Visualization on Grid Background Representing Data Processing Free Stock Image

Digital code illuminated over a grid background, symbolizing the complex realm of data processing, business analytics, and global finance. Ideal for tech industry promotions, educational content on computing advances, and materials showcasing cybersecurity and technology innovation.
Powered by  - Get 15% off with code: PIKWIZARD15


downloads
Tags:
More
Credit Photo
If you would like to credit the Photo, here are some ways you can do so
Text Link
photo Link
<span class="text-link">
<span>
<a target="_blank" href=https://pikwizard.com/photo/digital-code-visualization-on-grid-background-representing-data-processing/eaeedd2280d24bdb2da4967b131abf7a/>PikWizard</a>
</span>
</span>
<span class="image-link">
<span
style="margin: 0 0 20px 0; display: inline-block; vertical-align: middle; width: 100%;"
>
<a
target="_blank"
href="https://pikwizard.com/photo/digital-code-visualization-on-grid-background-representing-data-processing/eaeedd2280d24bdb2da4967b131abf7a/"
style="text-decoration: none; font-size: 10px; margin: 0;"
>
<img src="https://thumbs.wbm.im/pw/medium/eaeedd2280d24bdb2da4967b131abf7a.jpg" style="margin: 0; width: 100%;" alt="Digital Code Visualization on Grid Background Representing Data Processing" />
<p style="font-size: 12px; margin: 0;">PikWizard</p>
</a>
</span>
</span>
Free (free of charge)
Free for personal and commercial use.
Author: People Creations
Similar Free Stock Images


Premium


Premium


Premium


Premium


Premium


Premium


Premium


Premium


Premium


Premium


Premium


Premium


Premium


Premium


Premium


Premium


Premium


Premium


Premium


Premium


Premium


Premium


Premium


Premium


Premium

Explore More Free Stock Images