- Home >
- Stock Photos >
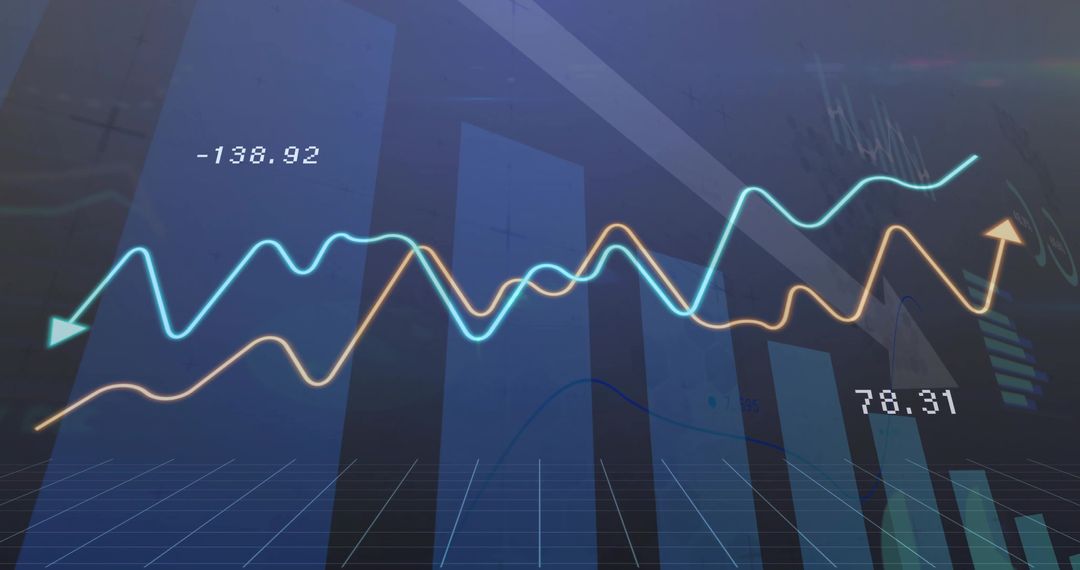
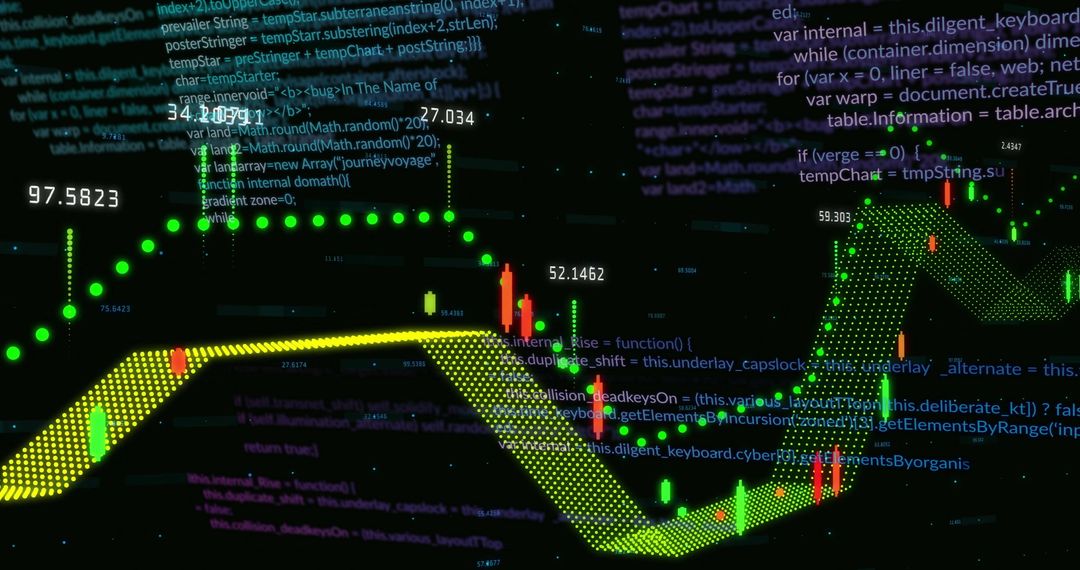
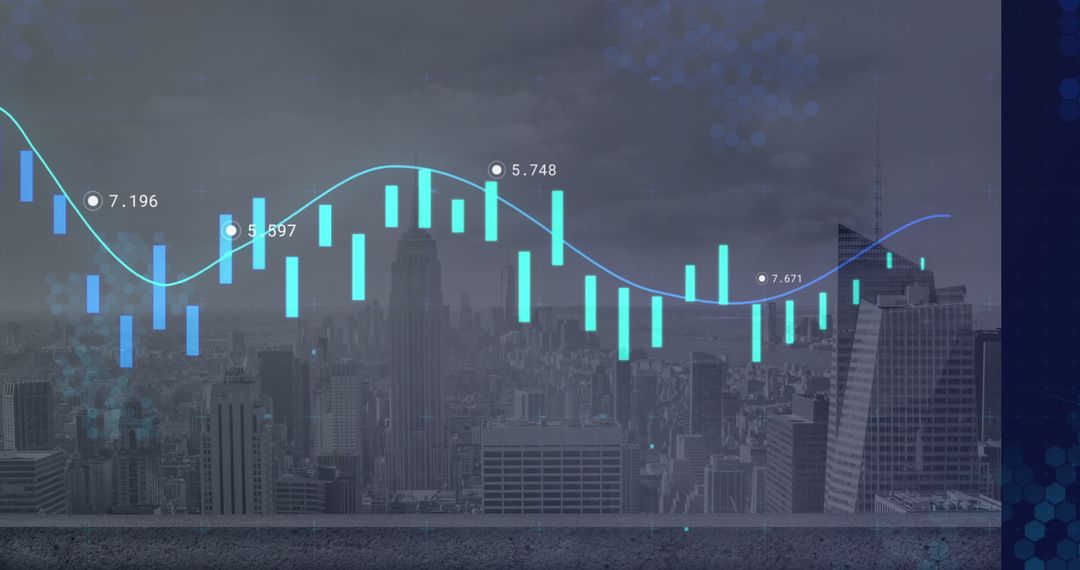
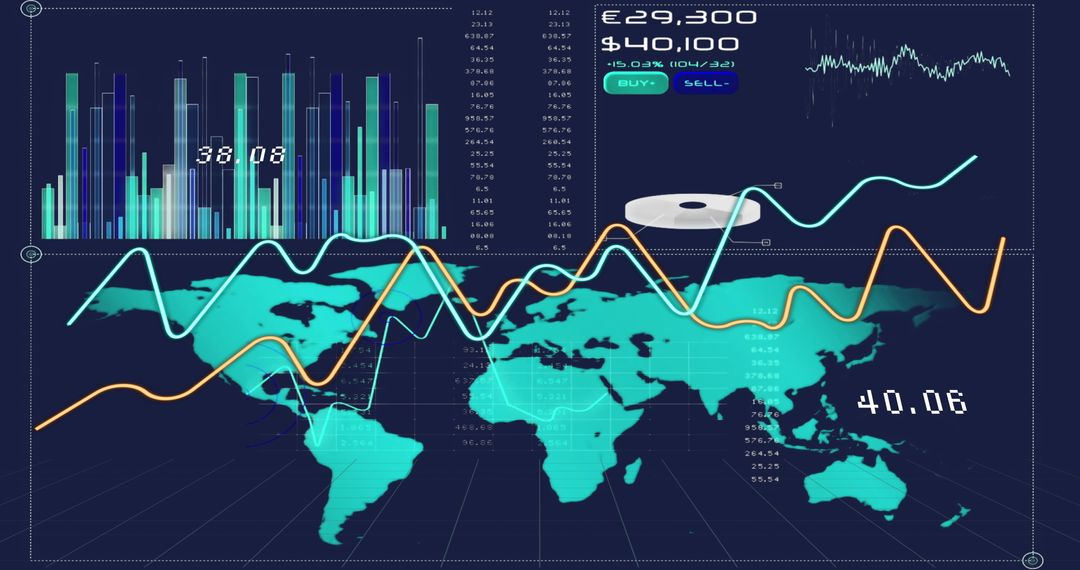
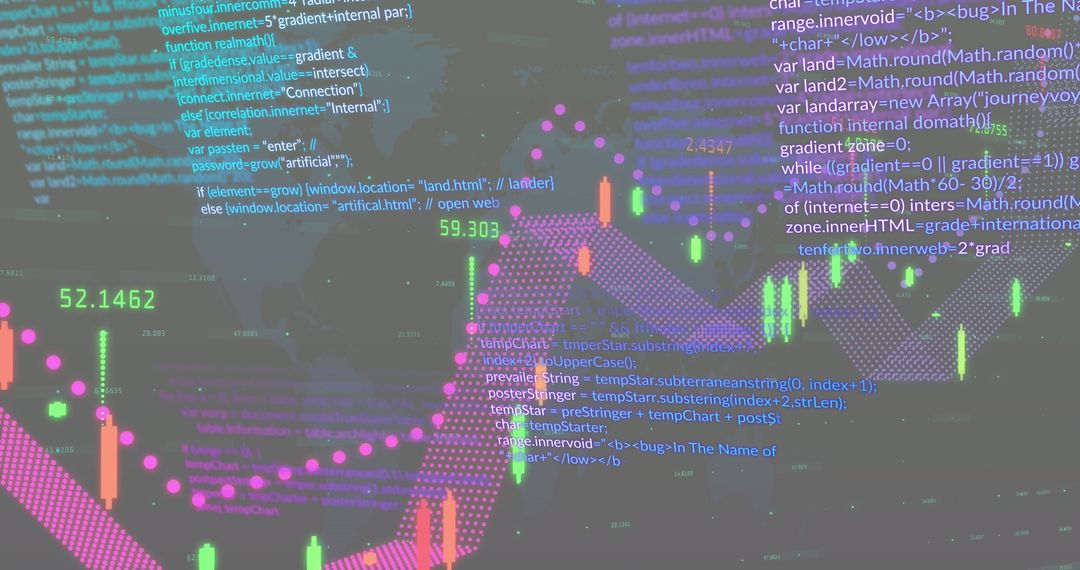
- Digital Coding and Financial Stock Market Graph Analysis
Digital Coding and Financial Stock Market Graph Analysis Image

Bright blue and green digital lines and numbers over financial graph depicting fluctuating stock market trends. Ideal for agricultural technology discussions, financial blog posts, or investment strategy presentations.
Powered by 


2
downloads
downloads
Tags:
More
Credit Photo
If you would like to credit the Photo, here are some ways you can do so
Text Link
photo Link
<span class="text-link">
<span>
<a target="_blank" href=https://pikwizard.com/photo/digital-coding-and-financial-stock-market-graph-analysis/78f02f75114309f7926e72e956faeaf2/>PikWizard</a>
</span>
</span>
<span class="image-link">
<span
style="margin: 0 0 20px 0; display: inline-block; vertical-align: middle; width: 100%;"
>
<a
target="_blank"
href="https://pikwizard.com/photo/digital-coding-and-financial-stock-market-graph-analysis/78f02f75114309f7926e72e956faeaf2/"
style="text-decoration: none; font-size: 10px; margin: 0;"
>
<img src="https://pikwizard.com/pw/medium/78f02f75114309f7926e72e956faeaf2.jpg" style="margin: 0; width: 100%;" alt="" />
<p style="font-size: 12px; margin: 0;">PikWizard</p>
</a>
</span>
</span>
Free (free of charge)
Free for personal and commercial use.
Author: Awesome Content
Similar Free Stock Images

Premium


Premium


Premium


Premium


Premium


Premium


Premium


Premium


Premium


Premium


Premium


Premium


Premium


Premium


Premium


Premium


Premium


Premium


Premium


Premium


Premium


Premium


Premium


Premium