
- Home >
- Stock Photos >
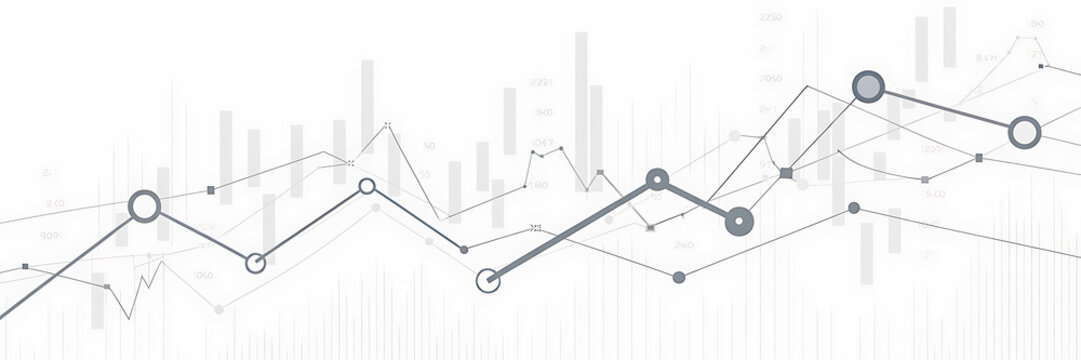
- Digital Dashboard Displaying Financial Chart and Analytics Interface
Digital Dashboard Displaying Financial Chart and Analytics Interface Image

Graphic densely portraying complex financial indicators. Dashboard displays dynamic line graphs and performance metrics, useful for illustrating trends in finance, technology of stock market; effective in presentations, articles of investment analysis.
Powered by 


downloads
Tags:
More
Credit Photo
If you would like to credit the Photo, here are some ways you can do so
Text Link
photo Link
<span class="text-link">
<span>
<a target="_blank" href=https://pikwizard.com/photo/digital-dashboard-displaying-financial-chart-and-analytics-interface/18f42aa9dc2333fa96a2c4a2d7f8b923/>PikWizard</a>
</span>
</span>
<span class="image-link">
<span
style="margin: 0 0 20px 0; display: inline-block; vertical-align: middle; width: 100%;"
>
<a
target="_blank"
href="https://pikwizard.com/photo/digital-dashboard-displaying-financial-chart-and-analytics-interface/18f42aa9dc2333fa96a2c4a2d7f8b923/"
style="text-decoration: none; font-size: 10px; margin: 0;"
>
<img src="https://pikwizard.com/pw/medium/18f42aa9dc2333fa96a2c4a2d7f8b923.jpg" style="margin: 0; width: 100%;" alt="" />
<p style="font-size: 12px; margin: 0;">PikWizard</p>
</a>
</span>
</span>
Free (free of charge)
Free for personal and commercial use.
Author: Awesome Content
Similar Free Stock Images

Premium


Premium

Premium


Premium


Premium


Premium


Premium


Premium


Premium


Premium


Premium


Premium


Premium


Premium

Premium


Premium


Premium

Premium


Premium


Premium


Premium


Premium


Premium


Premium


Premium

Explore More Free Stock Images