1. Home > 
  2. Stock Photos > 
  3. Digital Dashboard Displaying Financial Market Analysis

Digital Dashboard Displaying Financial Market Analysis Image

Digital Dashboard Displaying Financial Market Analysis

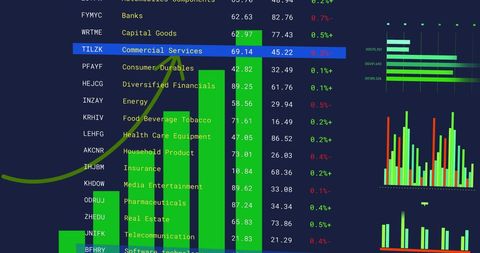
Innovative digital display used for exploring financial market data and statistics. Highlighting trends in stocks, industries, and economic sectors. Ideal for presentations and publications discussing technology's role in market analysis, financial planning, or investment strategy.

Powered by Shutterstock logo - Get 15% off with code: PIKWIZARD15
Conference Business Meeting Presentation: CEO Businessman Shows Data to Group of Investors, Businessspeople. Projector Screen Shows Graphs, Product Sales, Revenue Growth Strategy, e-Commerce Analysis - Powered by Shutterstock - Get 15% off with code: PIKWIZARD15Businessman using laptop computer analyzing sales data and financial growth graph chart report. Business planning, strategy and development. Financial accounting. market research, data analysis - Powered by Shutterstock - Get 15% off with code: PIKWIZARD15Business 2025 graphs statistics to analyze business potential concepts, Businesswomen use Laptop analytics charts, forecast the future, Marketing targets growth to optimize performance for profit. - Powered by Shutterstock - Get 15% off with code: PIKWIZARD15Two diverse crypto traders brokers stock exchange market investors discussing trading charts research reports growth using pc computer looking at screen analyzing invest strategy, financial risks. - Powered by Shutterstock - Get 15% off with code: PIKWIZARD15Internet cyberspace data information collection analytical statistics computer storage ai artificial intelligence calculation, blue background banner copyspace. - Powered by Shutterstock - Get 15% off with code: PIKWIZARD15

Credit Photo

If you would like to credit the Photo, here are some ways you can do so

Free (free of charge)

Free for personal and commercial use.

Author: Awesome Content

Similar Free Stock Images

Colorful Stock Market Display with Graphs and Tickers on Blue Background
Premium
Man look at the dashboard with graphs and charts. Concept of data management system, business intelligence, data statistics, marketing analysis, key performance indicators (KPI) and analytics.
Digital Stock Market Data Visualization in Binary Code
Digital Data Visualization with Global Financial Trends
Digital Stock Market Analysis on Green Background
Economic Trends Analysis with Financial Indicators and Graphs
Premium
Business graphs and charts on table. Financial development, Banking Account, Statistics
Digital Bar Graph Display in Financial Data Analysis
Financial Data Display in Digital Grid Design
Data Processing and Cloud Computing Server Room Visualization
Financial Data Graph Representation with Pink Overlay
Premium
Finance trade manager analysing stock market indicators for best investment strategy, financial data and charts with business buildings in background
Analyzing Stock Market Data Trends with Futuristic Visuals
Colorful Bar Graph with Data Overlay on Black Background
Futuristic Financial Data Digital Display Background
Digital Financial Graph Illustrating Stock Market Trends
Premium
Stock market analysis, business, finance and investment. Finance analyst analyzing stock market trading graph, economic growth chart, planning and strategy, business investment with financial report
Dynamic Stock Market Analysis on Digital Screen
Colorful Financial Data Analytics and Digital Graph
Innovative Digital Finance Data Display on Dark Interface
Digital Projection of Financial Data with Bar Graphs
Premium
Businessman showing result of growth company profit planning, opportunity, challenge and business strategy graphs and target of business. Banner of plan and visions for financial and economy analysis.
Futuristic Financial Data Analysis with Graphs and Charts
Dynamic Financial Data View with Stock Market Trends and Graphs
Digital Financial Data Graph on Black Screen Background
Dynamic Financial Graph Displaying Market Trends
Premium
Magnifying glass on graph paper. Financial development, Banking Account, Statistics, Investment Analytic research data economy, Business concept.
Financial Analytics Dashboard with Trend Lines and Data Visualization
Futuristic Financial Trading Dashboard with Data Analytics Visualization
Digital Analytics Interface with Data Trends and Performance Metrics
Dynamic HTML Code and Waveform Bar Interface for Cybersecurity
Digital Financial Data Analyzing with Bar and Line Graphs on Screen
Interactive Financial Graph on Digital Grid Background
Premium
Woman hold smartphone use pc at workplace. Project stats financial data sales charts on laptop and cellphone screen, close up view over shoulder. Report preparation, synchronization for safety concept
Abstract Financial Data Visualization in Digital Interface
Financial Data Analytics on Digital Interface Displaying Graphs
Digital Financial Data Analytics and Economic Trends
Digital Interface with Financial Data Displayed on Screen
Premium
Dashboard finance management on laptop computer analyzing sales data and growth graph chart report. Business planning, strategy and development. Financial accounting. market research, data analysis
Colorful Financial Data Display on Digital Screen for Trading and Analytics
Dynamic Financial Data Visualizations with Global Statistics
Digital Financial Data Analysis with Infographics and Charts
Financial Data Analysis with Code Interface on Black Background
Premium
Businessman using KPI dashboard.Financial business KPI System data analytics graph dashboard.Data System KPI and metrics connected in database for follow earnings,operations and sales data.
Dynamic Financial Data Analytics Display with Graphs
Dynamic Stocks and Trading Data Visualization
Digital Financial Analysis with Real-Time Stock Market Data
Stock Market Data Visualization with Trend Lines
Premium
Stock exchange market traders investors working on financial trading charts analysis. Two happy busy business men analysts consulting on digital finance forecast using laptop in office. Copy space.
Financial Data Against Bolivia Flag with Colorful Bar and Line Graphs
Dynamic Digital Data Processing and Analysis Graphs
Digital Display of Financial Data with Graph and Figures
Financial Data Projection in Modern Office Space
Premium
Focused african analyst showing client or colleague annual financial report analyzing business data on laptop screen using software for digital graphic statistic analysis, economic market graphs
Digital Graphs Overlaying Office Desk with Computers
Financial Data Graph on Digital Screen Displaying Market Trends
Digital Data Processing Overlay with Graphs and Charts
Neon Stock Market Dashboard with Animated Data Interface
Premium
Man look at the dashboard with graphs and charts. Concept of data management system, business intelligence, data statistics, marketing analysis, key performance indicators (KPI) and analytics.
Data Visualization Merging Cyber Security Code Elements with Analytics Graphs
Digital Candlestick Chart on Virtual Grid in Blue Tone
Cybersecurity Dashboard With Data and Code Elements Display
Financial Data Charts on Digital Interface Background
Digital Financial Data Visualization with Urban Cityscape
Digital Financial Data Visualizations on Blue Interface
Premium
Using tablet pc, Consultant between bookkeepers and accounting lawyer consultation about asset, balance sheet, stock market statistics and yearly tax law, protect business from bribery.
Dynamic Financial Data Flow and Market Analysis in Motion
Navigating Stock Market Trends through Digital Analytics
Dynamic Stock Market Data Visualization on Digital Screen
Global Financial Data and Stock Market Analytics
Premium
Business finance data analytics graph.Financial management technology.Advisor using KPI Dashboard on virtual screen.
Transparent Stock Market Chart Highlighting Financial Trends
Dynamic Stock Market Graphics on Modern Digital Interface
Digital Data Visualization with Futuristic Infographics
Dynamic Stock Market Analysis with Multicolored Statistics
Premium
Business graphs, charts and magnifying glass on table. Financial development, Banking Account, Statistics
Colorful Data Analytics Bar Graphs on Digital Screen
Statistical Financial Data Analysis on Digital Grid
Abstract Digital Stock Market Interface with Graphs and Data
Transforming Data and Financial Analysis on Pink Graph
Premium
Analytical data and development statistics. Web analytics and product testing techniques are being measured. A guy studies an SEO dashboard and a digital report.
Colorful Bar Graph Overlaying Financial Market Data
Financial Data Analysis with Graphs and Charts on Dark Background
Colorful Data Analytics Display on Dark Background
Dynamic Financial Data Visualization with Binary Code Overlay
Premium
Young woman working at modern office.Technical price graph and indicator, red and green candlestick chart and stock trading computer screen background. Double exposure. Trader analyzing data
Digital Stock Market Data with Upward Trend Graph
Digital Financial Data Analysis on Abstract Blue Background
Modern Data Dashboard Display with Interactive Charts
Dynamic Financial Graphs and Dashboard Analytics
Premium
Analyst utilizing technology and dashboard with charts data science and Big Data technology for business, Strategic data management system with KPI organization performance with technology and metrics
Encrypted Data on Digital Interface with Analytics Charts
Holographic financial analytics dashboard displaying neon code with rising line charts
Complex Financial Data Analysis on Purple Grid Background
Financial Data Analysis Over Vibrant Cityscape Background
Digital Financial Data and Stock Market Charts
Financial Data Visualization in Modern Digital Display Office
Premium
business documents on office table with smart phone and laptop computer and graph financial with social network diagram and three colleagues discussing data in the background
Stock Market Graph Overlay with Digital Interface Effects
Dynamic Stock Market Analytics Display on Blue Background
Digital Interface with Stock Data and Analytics
Financial Data Visualization on Digital Grid
Premium
Financial advisor explaining invest stock market data consulting investor. Two busy business men analysts doing finance trading analysis pointing at exchange chart on laptop screen working in office.
Digital Financial Data Display Tracking Market Trends
Vibrant Stock Market Display Illustrating Trading Volatility
Dynamic Financial Stock Market Display with Analytical Data
Digital Financial Data Processing and Analysis
Premium
Analyzing Key Performance Indicators. Businessman using digital screen to analyze key performance indicators (KPI) with various graphs and charts, showcasing data analysis and performance tracking.
Financial Data Visualization with Graphs and Charts on Navy Background
Dynamic Financial Data Chart on Blue Background
Global Financial Data on Virtual Screen Displaying Stock Market Trends
Global Financial Data Analysis on Grid Background
Premium
Executive business team people group working with paperwork standing at table, analyzing corporate strategy concept, reviewing plan, managing financial project overview at office meeting, close up.
Stock Market Analysis with Graphs and Trading Data
Financial Stock Market Trends Over Digital Grid Background
Abstract Network with Stock Market Data Overlay
Dynamic Graphic of Financial Data Displayed on Graph
Premium
Team of financial people discussing a business analytics (BA) or intelligence (BI) dashboard on the computer screen showing sales and operations data statistics and key performance indicators (KPI)
Financial Data Processing on Digital Graph Displayed on Screen
Digital trading screen with rising charts and data analytics
Interactive Data Visualization Dashboard with Trend Analysis
Interactive 3D Graph with Digital Numeric Overlay
Premium
Financial analyst analysis business financial report on digital tablet during discussion at meeting of corporate showing the results of their successful teamwork.
Neon finance analytics dashboard streaming binary code with volatile line charts