
- Home >
- Stock Photos >
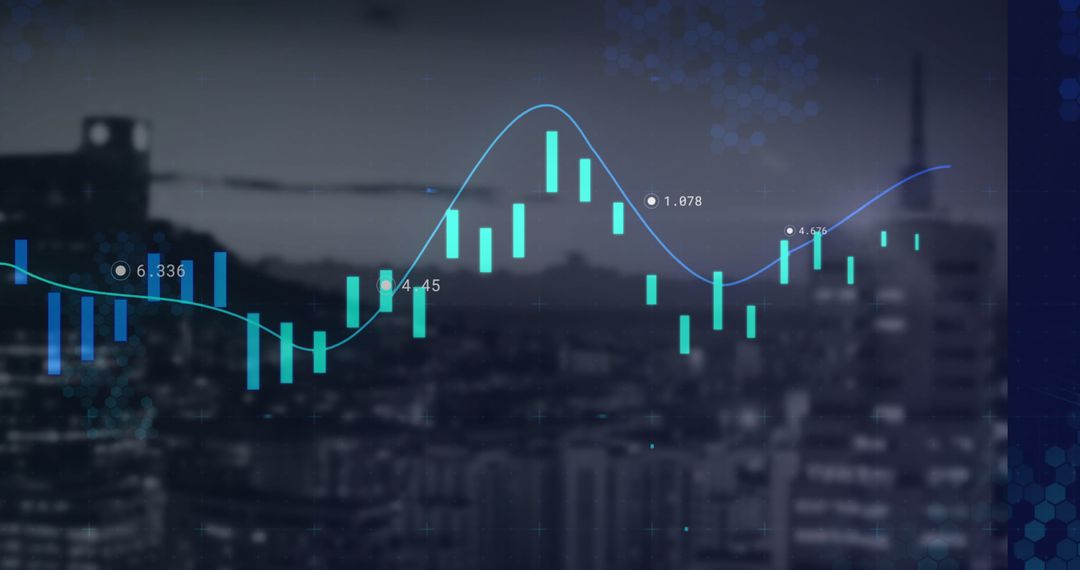
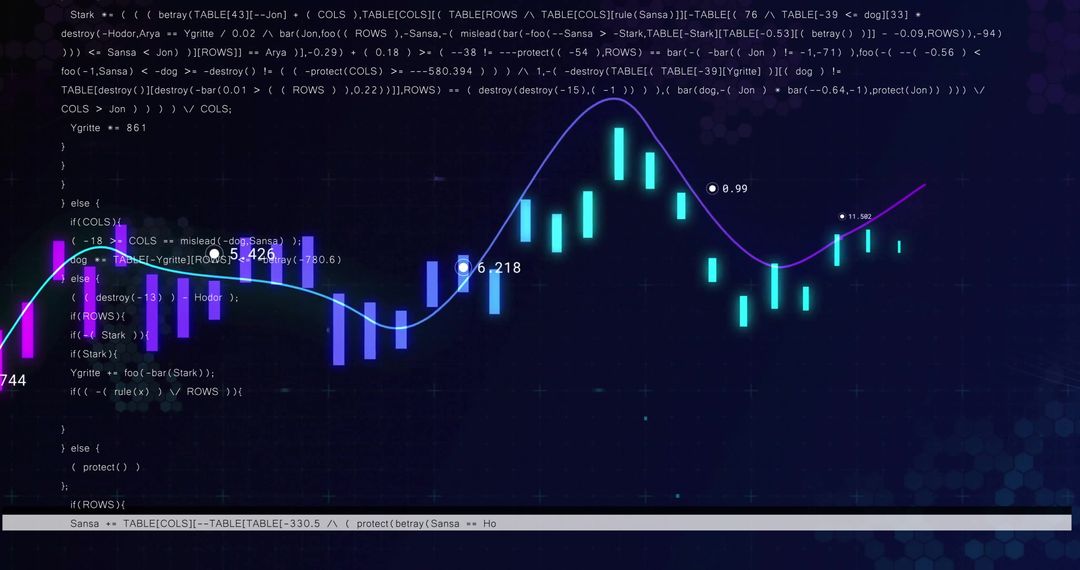
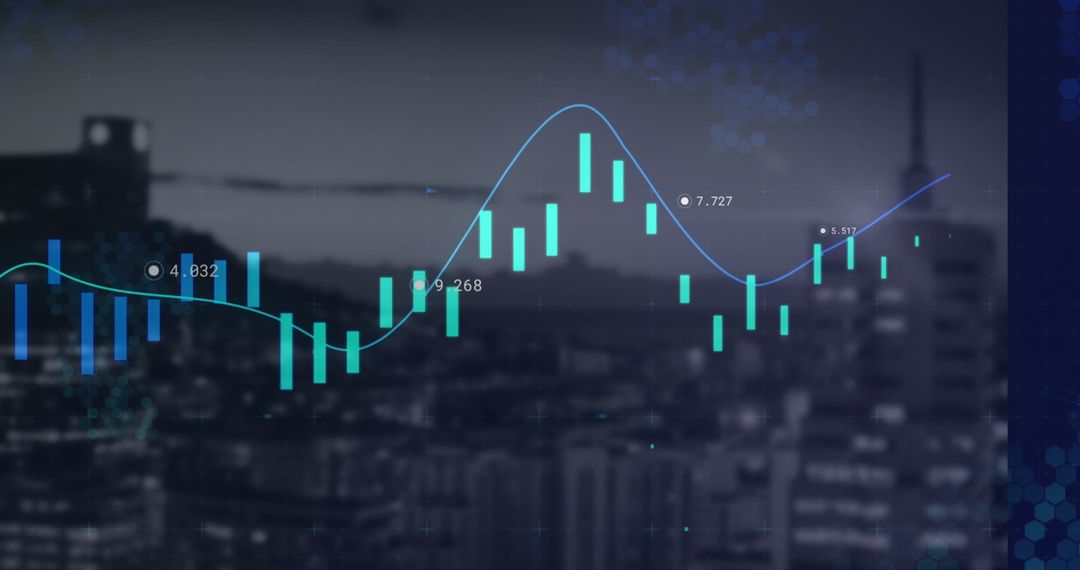
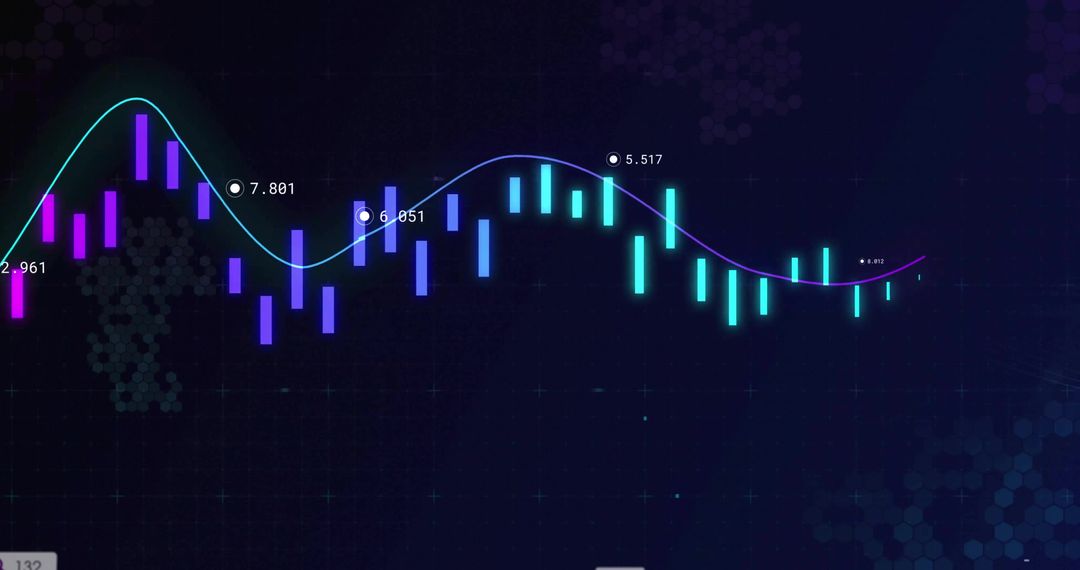
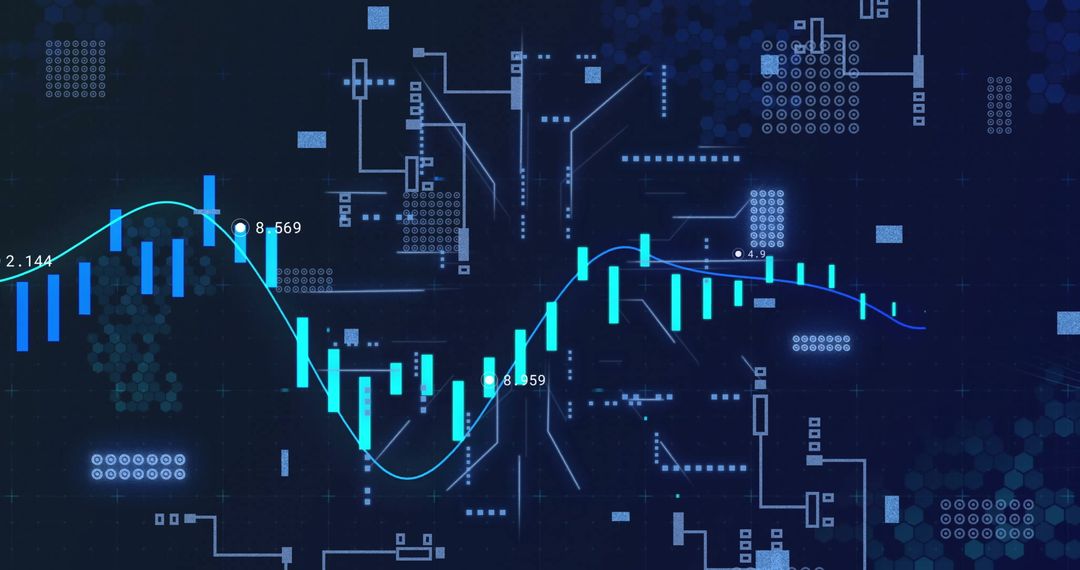
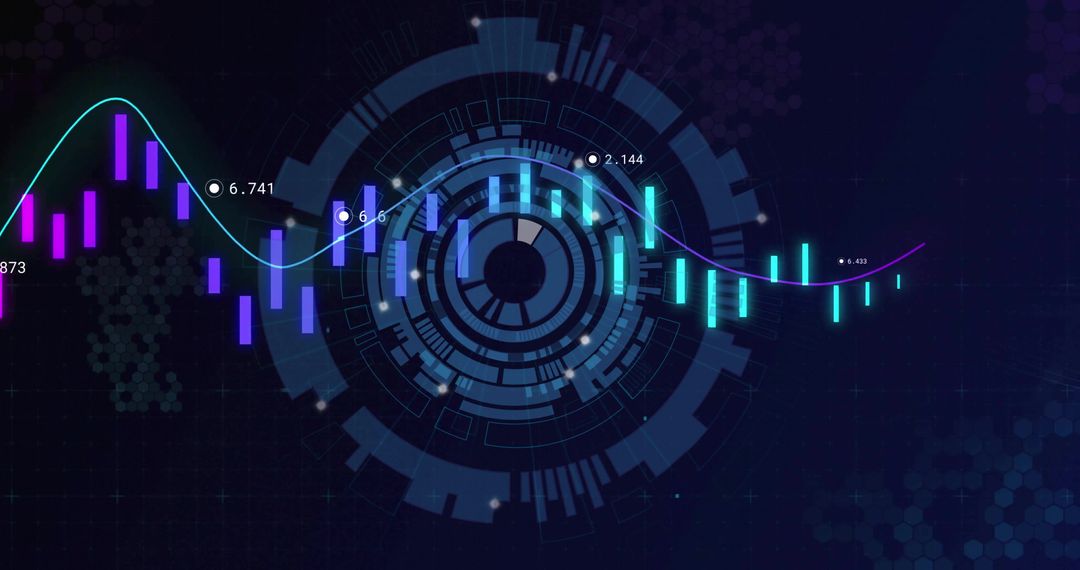
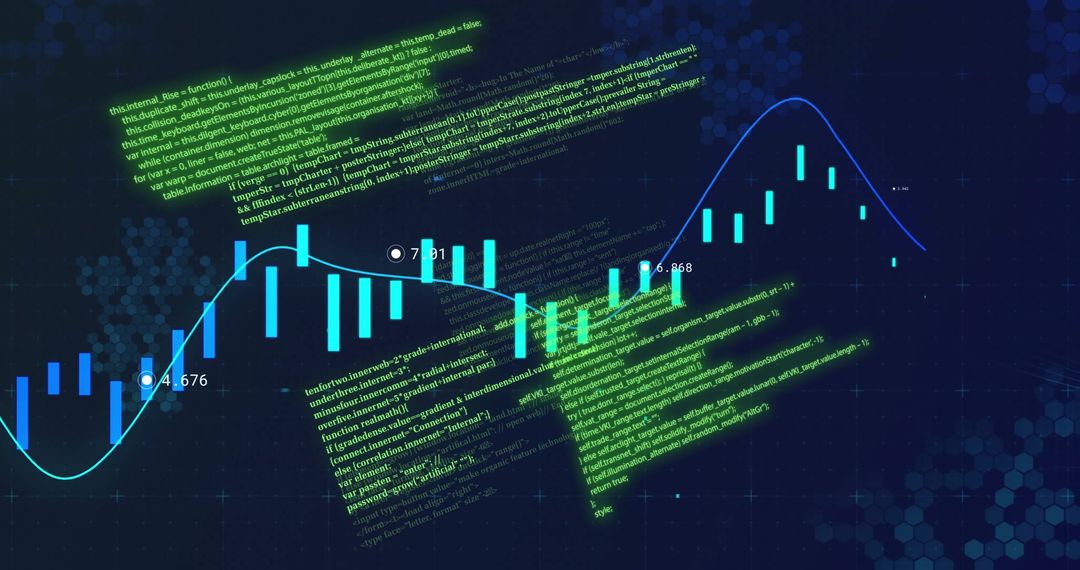
- Digital Dashboard With Candlestick Bar and Line Graph Interface
Digital Dashboard With Candlestick Bar and Line Graph Interface Image

Image depicts a digital interface on a computer screen featuring candlestick bars alongside a vibrant line graph. Labels and snippets of code suggest analytical metrics or forex trading calculations. Suitable for illustrating concepts in stock market analysis, financial data interpretation, technology, and modern financial infrastructure. Perfect for use in presentations, websites targeting financial industry professionals, or educational platforms focused on trading and analytics.
Powered by  - Get 15% off with code: PIKWIZARD15


0
downloads
downloads
Tags:
More
Credit Photo
If you would like to credit the Photo, here are some ways you can do so
Text Link
photo Link
<span class="text-link">
<span>
<a target="_blank" href=https://pikwizard.com/photo/digital-dashboard-with-candlestick-bar-and-line-graph-interface/eb832b8231e801c3bd0906040a78e854/>PikWizard</a>
</span>
</span>
<span class="image-link">
<span
style="margin: 0 0 20px 0; display: inline-block; vertical-align: middle; width: 100%;"
>
<a
target="_blank"
href="https://pikwizard.com/photo/digital-dashboard-with-candlestick-bar-and-line-graph-interface/eb832b8231e801c3bd0906040a78e854/"
style="text-decoration: none; font-size: 10px; margin: 0;"
>
<img src="https://pikwizard.com/pw/medium/eb832b8231e801c3bd0906040a78e854.jpg" style="margin: 0; width: 100%;" alt="" />
<p style="font-size: 12px; margin: 0;">PikWizard</p>
</a>
</span>
</span>
Free (free of charge)
Free for personal and commercial use.
Author: People Creations
Similar Free Stock Images

Premium


Premium


Premium


Premium


Premium


Premium


Premium


Premium


Premium


Premium


Premium


Premium


Premium


Premium


Premium


Premium


Premium


Premium


Premium


Premium


Premium


Premium


Premium


Premium

