
- Home >
- Free Stock Photos & Images >
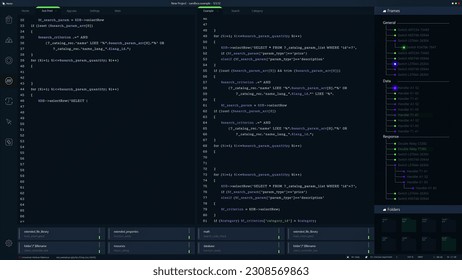
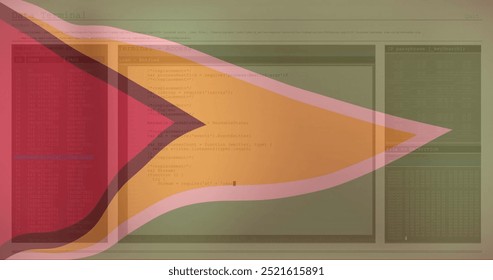
- Digital Data Analysis C Code Interface with Graph Visualization
Digital Data Analysis C Code Interface with Graph Visualization Free Stock Image

This image depicts a dynamic digital interface with C code programming on display, surrounded by overlays and zigzag graph references. Ideal for illustrating concepts in technology innovation, software development, and data analysis tools. Useful for educational content, programming tutorials, tech blogs, or presentations focusing on information visualization and analytics.
Powered by  - Get 15% off with code: PIKWIZARD15


downloads
Tags:
More
Credit Photo
If you would like to credit the Photo, here are some ways you can do so
Text Link
photo Link
<span class="text-link">
<span>
<a target="_blank" href=https://pikwizard.com/photo/digital-data-analysis-c-code-interface-with-graph-visualization/6cde71376fed0b59decc59efe4278884/>PikWizard</a>
</span>
</span>
<span class="image-link">
<span
style="margin: 0 0 20px 0; display: inline-block; vertical-align: middle; width: 100%;"
>
<a
target="_blank"
href="https://pikwizard.com/photo/digital-data-analysis-c-code-interface-with-graph-visualization/6cde71376fed0b59decc59efe4278884/"
style="text-decoration: none; font-size: 10px; margin: 0;"
>
<img src="https://thumbs.wbm.im/pw/medium/6cde71376fed0b59decc59efe4278884.jpg" style="margin: 0; width: 100%;" alt="Digital Data Analysis C Code Interface with Graph Visualization" />
<p style="font-size: 12px; margin: 0;">PikWizard</p>
</a>
</span>
</span>
Free (free of charge)
Free for personal and commercial use.
Author: People Creations
Similar Free Stock Images


Premium


Premium


Premium


Premium


Premium


Premium


Premium


Premium


Premium


Premium


Premium


Premium


Premium


Premium


Premium


Premium


Premium


Premium


Premium


Premium


Premium


Premium


Premium


Premium


Premium

Explore More Free Stock Images