
- Home >
- Stock Photos >
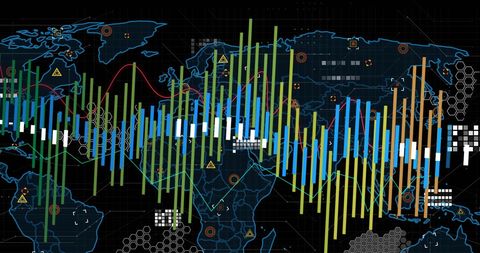
- Digital Data Analysis Over World Map with Graphs and Codes
Digital Data Analysis Over World Map with Graphs and Codes Image

Abstract illustration of technological data processing displayed with various graphs overlaid on a stylized world map. Ideal for use in presentations focusing on global economics, technology, data science or stock trading. It symbolizes global connectivity and contemporary computing advancements, making it suitable for backgrounds or infographics in related industries.
Powered by 


downloads
Tags:
More
Credit Photo
If you would like to credit the Photo, here are some ways you can do so
Text Link
photo Link
<span class="text-link">
<span>
<a target="_blank" href=https://pikwizard.com/photo/digital-data-analysis-over-world-map-with-graphs-and-codes/54276ca20a1a0c546ec30c0a13b453d1/>PikWizard</a>
</span>
</span>
<span class="image-link">
<span
style="margin: 0 0 20px 0; display: inline-block; vertical-align: middle; width: 100%;"
>
<a
target="_blank"
href="https://pikwizard.com/photo/digital-data-analysis-over-world-map-with-graphs-and-codes/54276ca20a1a0c546ec30c0a13b453d1/"
style="text-decoration: none; font-size: 10px; margin: 0;"
>
<img src="https://pikwizard.com/pw/medium/54276ca20a1a0c546ec30c0a13b453d1.jpg" style="margin: 0; width: 100%;" alt="" />
<p style="font-size: 12px; margin: 0;">PikWizard</p>
</a>
</span>
</span>
Free (free of charge)
Free for personal and commercial use.
Author: Awesome Content
Similar Free Stock Images

Premium


Premium


Premium


Premium


Premium


Premium


Premium

Premium

Premium


Premium


Premium


Premium

Premium


Premium


Premium


Premium


Premium


Premium

Premium

Premium


Premium

Premium


Premium


Premium


Premium


Explore More Free Stock Images