- Home >
- Stock Photos >
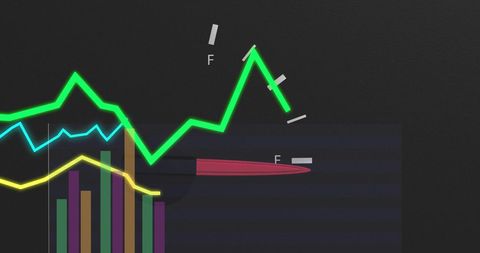
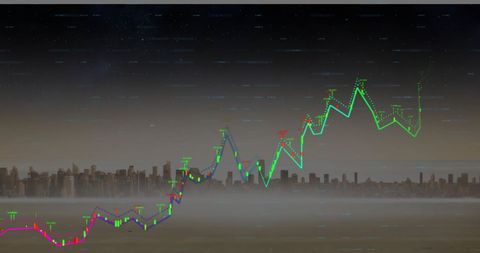
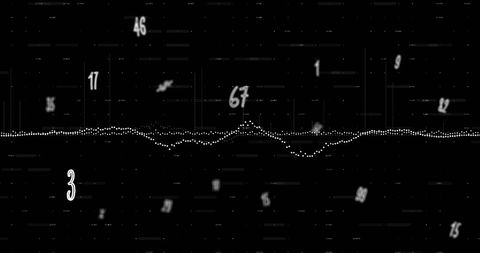
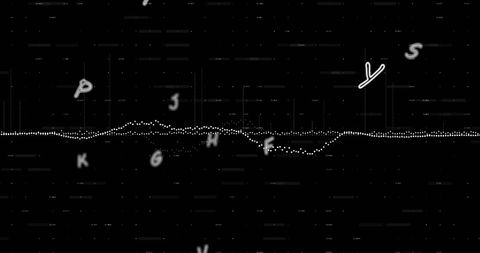
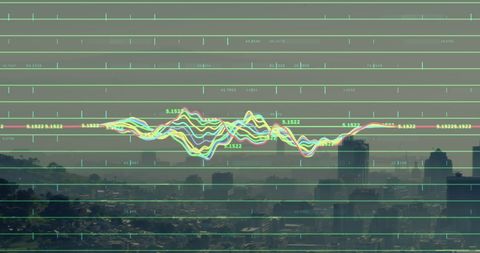
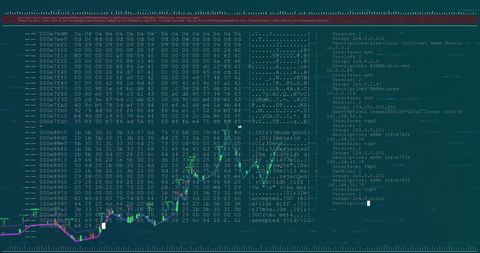
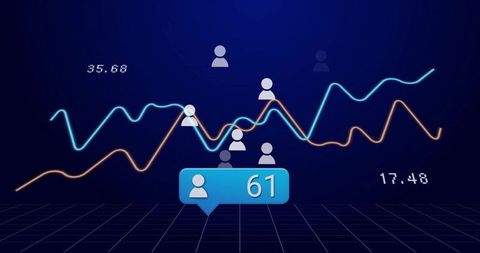
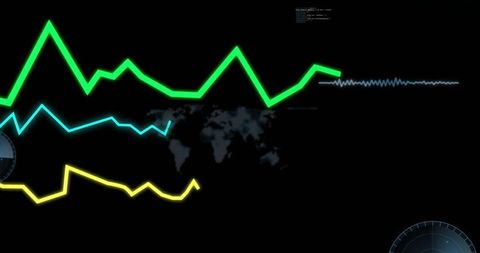
- Digital Data Analysis with Moving Shapes and Numbers
Digital Data Analysis with Moving Shapes and Numbers Image

Dynamic visual depicting digital data analysis with colorful numbers and wave-like graphs, suggesting complex data interpretation. Perfect for conveying concepts in digital analysis, financial forecasting, technology promotions, or the significance of numerical data in business strategy.

downloads
Tags:
More
Credit Photo
If you would like to credit the Photo, here are some ways you can do so
Text Link
photo Link
<span class="text-link">
<span>
<a target="_blank" href=https://pikwizard.com/photo/digital-data-analysis-with-moving-shapes-and-numbers/a73e8858b98d28c7571a60edd2bc6356/>PikWizard</a>
</span>
</span>
<span class="image-link">
<span
style="margin: 0 0 20px 0; display: inline-block; vertical-align: middle; width: 100%;"
>
<a
target="_blank"
href="https://pikwizard.com/photo/digital-data-analysis-with-moving-shapes-and-numbers/a73e8858b98d28c7571a60edd2bc6356/"
style="text-decoration: none; font-size: 10px; margin: 0;"
>
<img src="https://pikwizard.com/pw/medium/a73e8858b98d28c7571a60edd2bc6356.jpg" style="margin: 0; width: 100%;" alt="" />
<p style="font-size: 12px; margin: 0;">PikWizard</p>
</a>
</span>
</span>
Free (free of charge)
Free for personal and commercial use.
Author: Authentic Images