
- Home >
- Stock Photos >
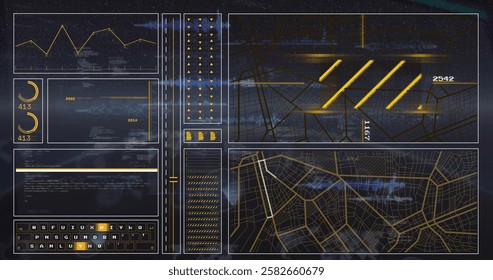
- Digital Data Processing Interface with Code and Graph
Digital Data Processing Interface with Code and Graph Image

Vibrant digital display showcasing data processing with overlays of code and graph in green hues, perfect for illustrating concept of cloud computing and cybersecurity. Suitable for data analysis and information technology themes.
Powered by  - Get 15% off with code: PIKWIZARD15


downloads
Tags:
More
Credit Photo
If you would like to credit the Photo, here are some ways you can do so
Text Link
photo Link
<span class="text-link">
<span>
<a target="_blank" href=https://pikwizard.com/photo/digital-data-processing-interface-with-code-and-graph/39b7ff8d778c992274215de461042a28/>PikWizard</a>
</span>
</span>
<span class="image-link">
<span
style="margin: 0 0 20px 0; display: inline-block; vertical-align: middle; width: 100%;"
>
<a
target="_blank"
href="https://pikwizard.com/photo/digital-data-processing-interface-with-code-and-graph/39b7ff8d778c992274215de461042a28/"
style="text-decoration: none; font-size: 10px; margin: 0;"
>
<img src="https://pikwizard.com/pw/medium/39b7ff8d778c992274215de461042a28.jpg" style="margin: 0; width: 100%;" alt="" />
<p style="font-size: 12px; margin: 0;">PikWizard</p>
</a>
</span>
</span>
Free (free of charge)
Free for personal and commercial use.
Author: People Creations
Similar Free Stock Images

Premium


Premium
Premium


Premium


Premium


Premium


Premium


Premium


Premium

Premium

Premium
Premium


Premium


Premium


Premium


Premium


Premium


Premium


Premium


Premium

Premium


Premium

Premium


Premium


Premium


Explore More Free Stock Images