
- Home >
- Stock Photos >
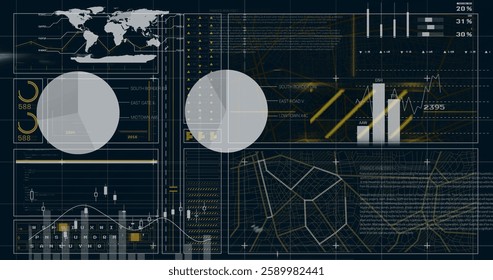
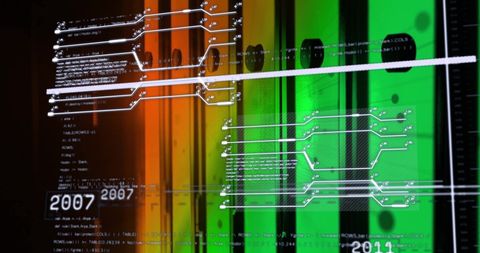
- Digital Data Processing with Modern Interface on Dark Background
Digital Data Processing with Modern Interface on Dark Background Image

Futuristic depiction of digital data processing amid a sophisticated, grid-like interface. Ideal for illustrating concepts in global finance, advanced computing, and data connections. Can enhance content related to technology, science, or finance.
Powered by  - Get 15% off with code: PIKWIZARD15


downloads
Tags:
More
Credit Photo
If you would like to credit the Photo, here are some ways you can do so
Text Link
photo Link
<span class="text-link">
<span>
<a target="_blank" href=https://pikwizard.com/photo/digital-data-processing-with-modern-interface-on-dark-background/68b86f39961359005a9434a5c4fe4bd1/>PikWizard</a>
</span>
</span>
<span class="image-link">
<span
style="margin: 0 0 20px 0; display: inline-block; vertical-align: middle; width: 100%;"
>
<a
target="_blank"
href="https://pikwizard.com/photo/digital-data-processing-with-modern-interface-on-dark-background/68b86f39961359005a9434a5c4fe4bd1/"
style="text-decoration: none; font-size: 10px; margin: 0;"
>
<img src="https://pikwizard.com/pw/medium/68b86f39961359005a9434a5c4fe4bd1.jpg" style="margin: 0; width: 100%;" alt="" />
<p style="font-size: 12px; margin: 0;">PikWizard</p>
</a>
</span>
</span>
Free (free of charge)
Free for personal and commercial use.
Author: People Creations
Similar Free Stock Images
Premium


Premium


Premium


Premium


Premium


Premium


Premium


Premium


Premium

Premium

Premium


Premium


Premium


Premium


Premium


Premium


Premium

Premium


Premium


Premium


Premium


AI


Premium


Premium


Premium


Premium

Explore More Free Stock Images