- Home >
- Stock Photos >
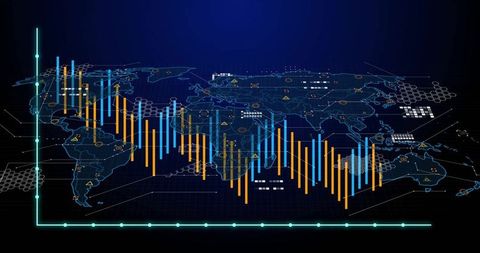
- Digital Data Processing with Vibrant Graphs
Digital Data Processing with Vibrant Graphs Image

Dynamic visual of multicolored flowing graphs and bar charts depicting continuous data analysis in a technological context. Blue background accentuates bright data graphics, suggesting themes of global business, communications, and financial analytics. Suitable for content related to finance, data science, high-tech presentations, and statistics-focused projects.

downloads
Tags:
More
Credit Photo
If you would like to credit the Photo, here are some ways you can do so
Text Link
photo Link
<span class="text-link">
<span>
<a target="_blank" href=https://pikwizard.com/photo/digital-data-processing-with-vibrant-graphs/dc7999528f3538950f402344426439d8/>PikWizard</a>
</span>
</span>
<span class="image-link">
<span
style="margin: 0 0 20px 0; display: inline-block; vertical-align: middle; width: 100%;"
>
<a
target="_blank"
href="https://pikwizard.com/photo/digital-data-processing-with-vibrant-graphs/dc7999528f3538950f402344426439d8/"
style="text-decoration: none; font-size: 10px; margin: 0;"
>
<img src="https://pikwizard.com/pw/medium/dc7999528f3538950f402344426439d8.jpg" style="margin: 0; width: 100%;" alt="" />
<p style="font-size: 12px; margin: 0;">PikWizard</p>
</a>
</span>
</span>
Free (free of charge)
Free for personal and commercial use.
Author: Creative Art