
- Home >
- Stock Photos >
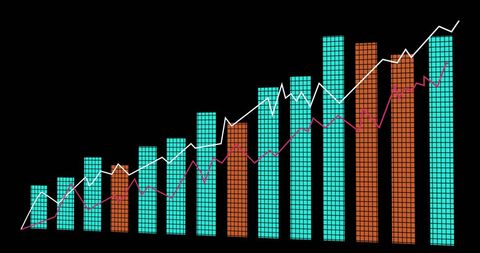
- Digital Data Visualization with Binary Grid and Colorful Bar Line Chart
Digital Data Visualization with Binary Grid and Colorful Bar Line Chart Image

Graphic depicts a sophisticated data visualization using a combination of bar and line charts in vivid turquoise and orange colors. White and magenta lines denote trends. Background displays binary digits, adding a digital technology aesthetic. Ideal for illustrating financial analysis, tech dashboards, or educational materials focused on quantitative information.
Powered by 


downloads
Tags:
More
Credit Photo
If you would like to credit the Photo, here are some ways you can do so
Text Link
photo Link
<span class="text-link">
<span>
<a target="_blank" href=https://pikwizard.com/photo/digital-data-visualization-with-binary-grid-and-colorful-bar-line-chart/b92ccfcc982e7074218a8665e718cc76/>PikWizard</a>
</span>
</span>
<span class="image-link">
<span
style="margin: 0 0 20px 0; display: inline-block; vertical-align: middle; width: 100%;"
>
<a
target="_blank"
href="https://pikwizard.com/photo/digital-data-visualization-with-binary-grid-and-colorful-bar-line-chart/b92ccfcc982e7074218a8665e718cc76/"
style="text-decoration: none; font-size: 10px; margin: 0;"
>
<img src="https://pikwizard.com/pw/medium/b92ccfcc982e7074218a8665e718cc76.jpg" style="margin: 0; width: 100%;" alt="" />
<p style="font-size: 12px; margin: 0;">PikWizard</p>
</a>
</span>
</span>
Free (free of charge)
Free for personal and commercial use.
Author: Awesome Content
Similar Free Stock Images

Premium


Premium


Premium


Premium

Premium

Premium


Premium


Premium


Premium


Premium


Premium


Premium


Premium


Premium


Premium


Premium


Premium

Premium

Premium


Premium

Premium


Premium


Premium

AI


Premium

Premium


Explore More Free Stock Images