
- Home >
- Stock Photos >
- Digital Data Visualization with Global Financial Charts
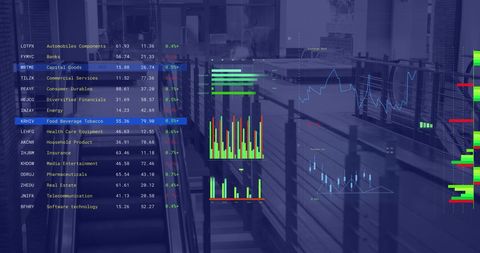
Digital Data Visualization with Global Financial Charts Image

This depicts a digital interface showing intertwining graphs and global grid patterns signifying data analysis and global finance. Useful for illustrating the themes of financial analytics, global market trends, data science, and technological advancements for marketing materials, educational content, or presentations.
Powered by 


downloads
Tags:
More
Credit Photo
If you would like to credit the Photo, here are some ways you can do so
Text Link
photo Link
<span class="text-link">
<span>
<a target="_blank" href=https://pikwizard.com/photo/digital-data-visualization-with-global-financial-charts/c7d070817b42f1dd7cee46f4b9558d2b/>PikWizard</a>
</span>
</span>
<span class="image-link">
<span
style="margin: 0 0 20px 0; display: inline-block; vertical-align: middle; width: 100%;"
>
<a
target="_blank"
href="https://pikwizard.com/photo/digital-data-visualization-with-global-financial-charts/c7d070817b42f1dd7cee46f4b9558d2b/"
style="text-decoration: none; font-size: 10px; margin: 0;"
>
<img src="https://pikwizard.com/pw/medium/c7d070817b42f1dd7cee46f4b9558d2b.jpg" style="margin: 0; width: 100%;" alt="" />
<p style="font-size: 12px; margin: 0;">PikWizard</p>
</a>
</span>
</span>
Free (free of charge)
Free for personal and commercial use.
Author: Authentic Images
Similar Free Stock Images

Premium


Premium


Premium


Premium


Premium


Premium


Premium

Premium


Premium


Premium


Premium


Premium

Premium


Premium


Premium


Premium


Premium

Premium

Premium


Premium


Premium


Premium


Premium


Premium

Premium


Explore More Free Stock Images