- Home >
- Stock Photos >
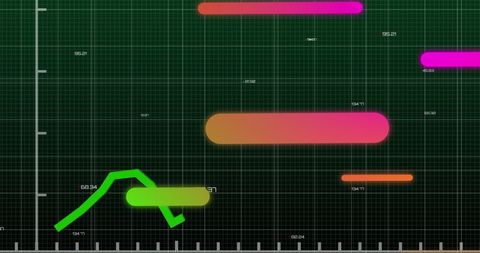
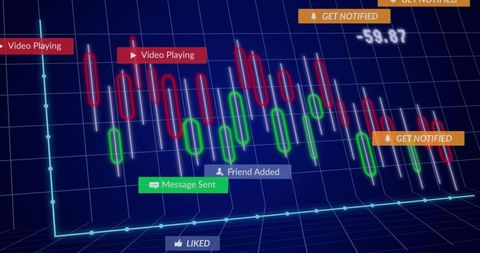
- Digital Data Visualization with Glowing Graphs and Code Overlay
Digital Data Visualization with Glowing Graphs and Code Overlay Image

This digital composition showcases an abstract representation of data visualization with illuminated bars and a grid pattern. The holographic effect conveys modern technology and data analysis themes, suitable for illustrating concepts in IT, high-tech business presentations, and database management reports.

downloads
Tags:
More
Credit Photo
If you would like to credit the Photo, here are some ways you can do so
Text Link
photo Link
<span class="text-link">
<span>
<a target="_blank" href=https://pikwizard.com/photo/digital-data-visualization-with-glowing-graphs-and-code-overlay/9ff1cf49c6fb5bb24171423af408aa8e/>PikWizard</a>
</span>
</span>
<span class="image-link">
<span
style="margin: 0 0 20px 0; display: inline-block; vertical-align: middle; width: 100%;"
>
<a
target="_blank"
href="https://pikwizard.com/photo/digital-data-visualization-with-glowing-graphs-and-code-overlay/9ff1cf49c6fb5bb24171423af408aa8e/"
style="text-decoration: none; font-size: 10px; margin: 0;"
>
<img src="https://pikwizard.com/pw/medium/9ff1cf49c6fb5bb24171423af408aa8e.jpg" style="margin: 0; width: 100%;" alt="" />
<p style="font-size: 12px; margin: 0;">PikWizard</p>
</a>
</span>
</span>
Free (free of charge)
Free for personal and commercial use.
Author: Authentic Images