- Home >
- Stock Photos >
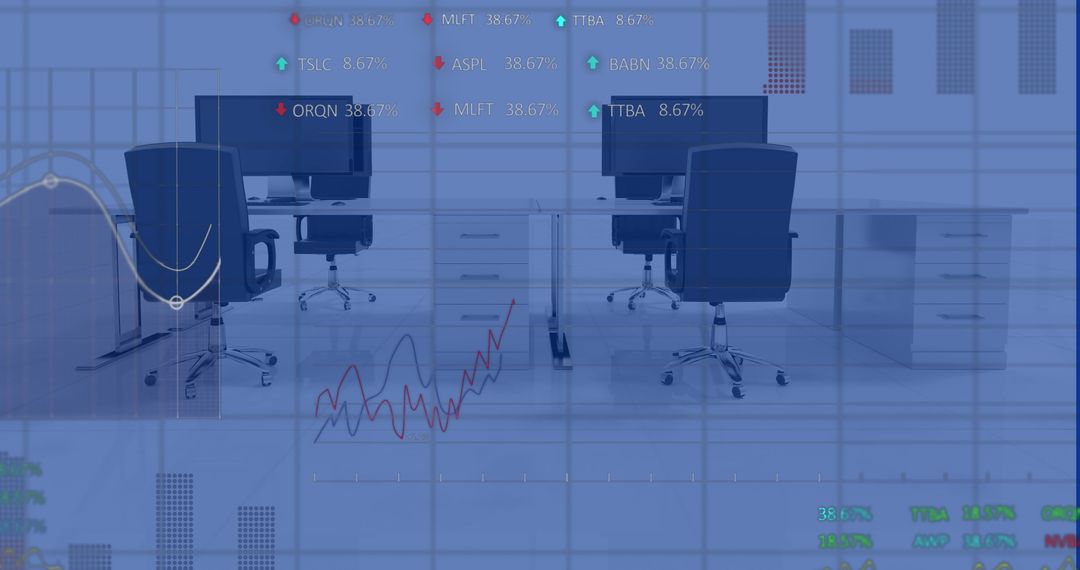
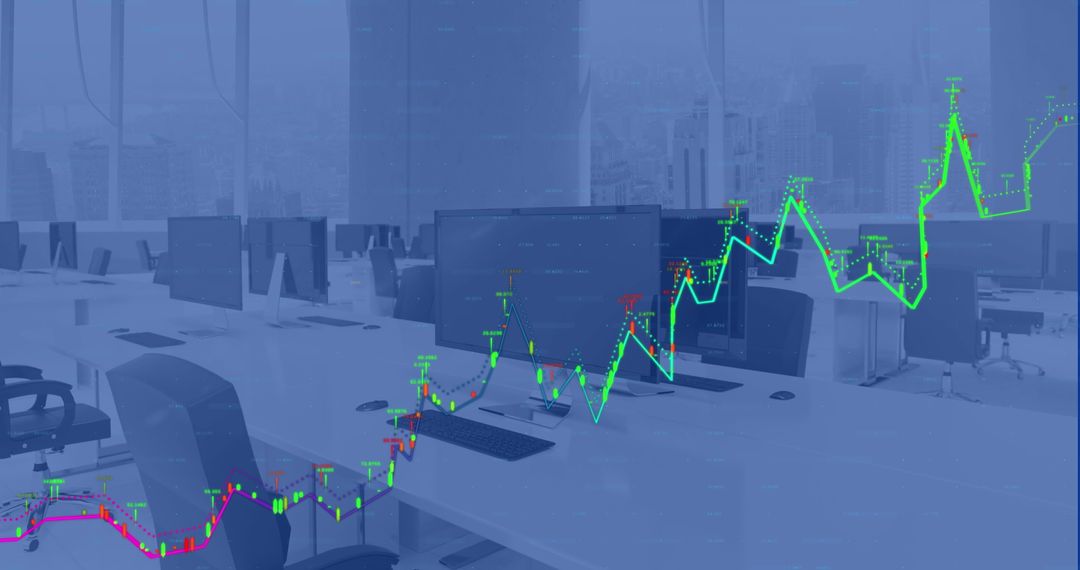
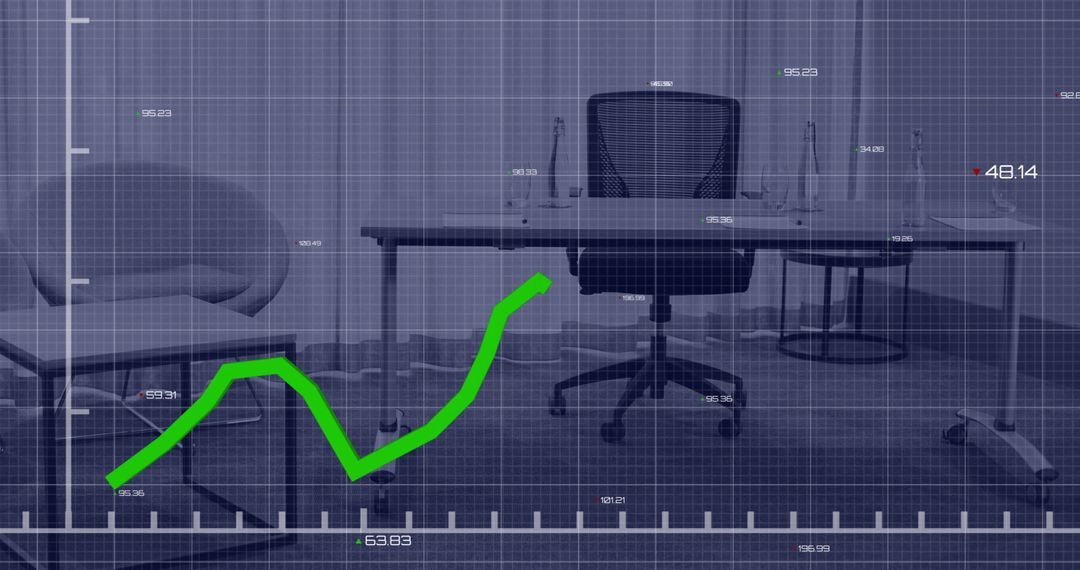
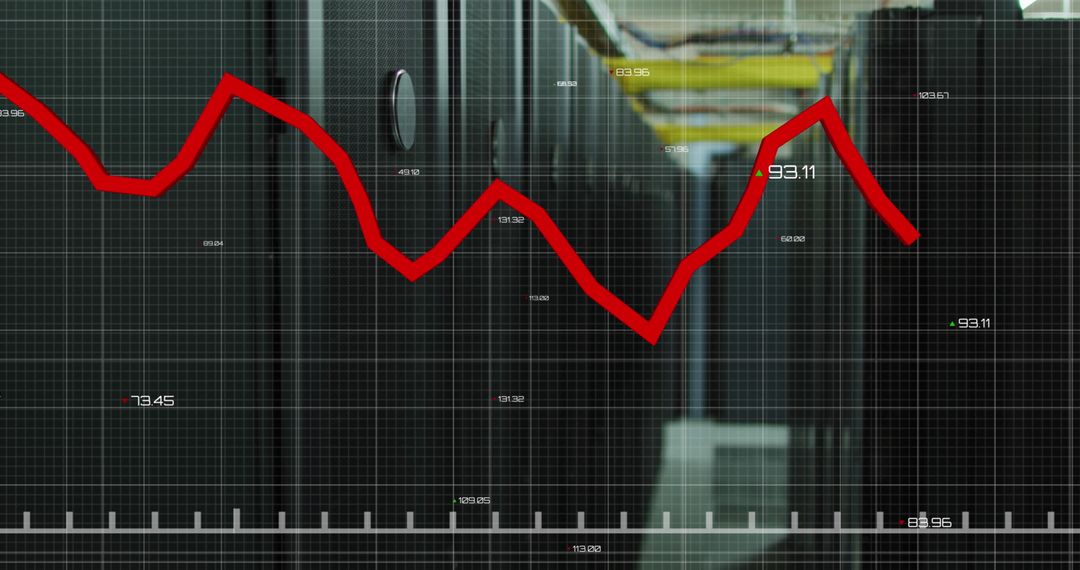
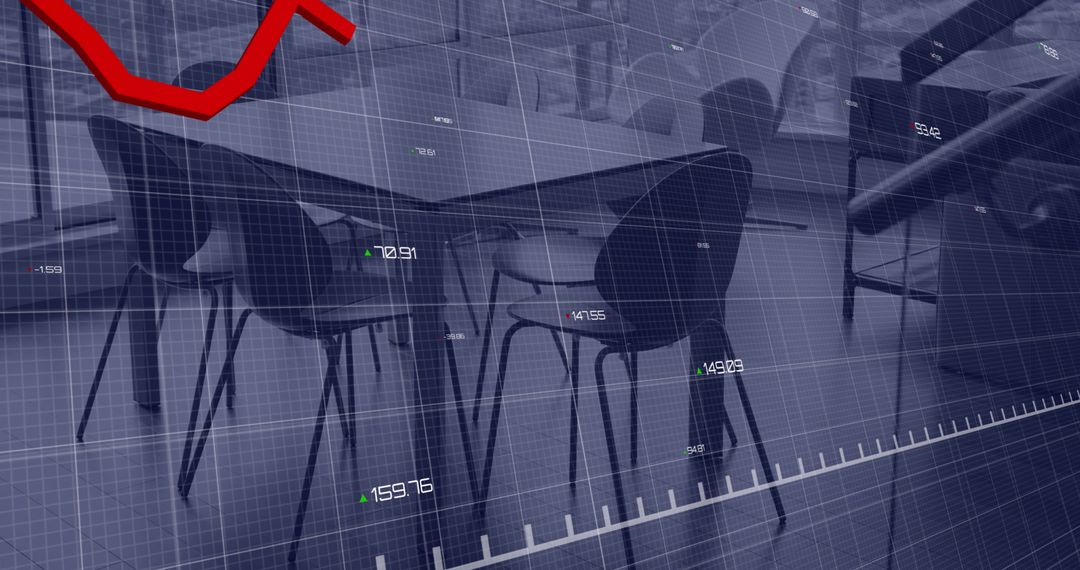
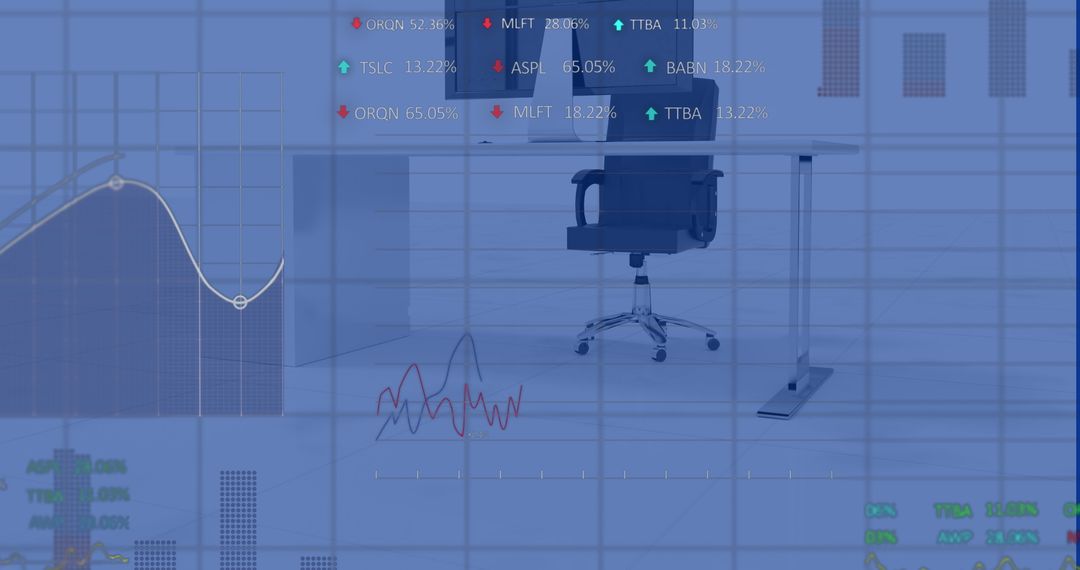
- Digital Display of Financial Downtrend in Modern Office
Digital Display of Financial Downtrend in Modern Office Image
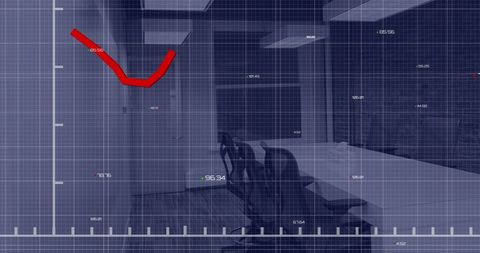
Digital display highlights financial downtrend indicated by a prominent red line overlaid on a modern office interior. This visual representation aids understanding of economic trends, useful for presentations, financial reports, and business strategy sessions, demonstrating how technology can integrate with financial sectors.
Powered by 


0
downloads
downloads
Tags:
More
Credit Photo
If you would like to credit the Photo, here are some ways you can do so
Text Link
photo Link
<span class="text-link">
<span>
<a target="_blank" href=https://pikwizard.com/photo/digital-display-of-financial-downtrend-in-modern-office/6cdc48d2e6432e0d897d65b4ded87d1c/>PikWizard</a>
</span>
</span>
<span class="image-link">
<span
style="margin: 0 0 20px 0; display: inline-block; vertical-align: middle; width: 100%;"
>
<a
target="_blank"
href="https://pikwizard.com/photo/digital-display-of-financial-downtrend-in-modern-office/6cdc48d2e6432e0d897d65b4ded87d1c/"
style="text-decoration: none; font-size: 10px; margin: 0;"
>
<img src="https://pikwizard.com/pw/medium/6cdc48d2e6432e0d897d65b4ded87d1c.jpg" style="margin: 0; width: 100%;" alt="" />
<p style="font-size: 12px; margin: 0;">PikWizard</p>
</a>
</span>
</span>
Free (free of charge)
Free for personal and commercial use.
Author: People Creations
Similar Free Stock Images

Premium


Premium


Premium


Premium


Premium


Premium


Premium


Premium


Premium


Premium


Premium


Premium


Premium


Premium


Premium


Premium


Premium


Premium


Premium


Premium


Premium


Premium


Premium


Premium