- Home >
- Stock Photos >
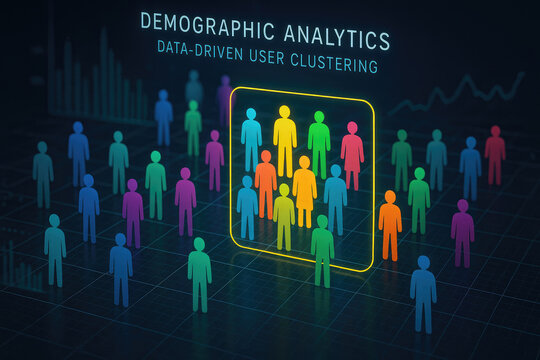
- Digital Finance Network with User Profiles and Graphs
Digital Finance Network with User Profiles and Graphs Image

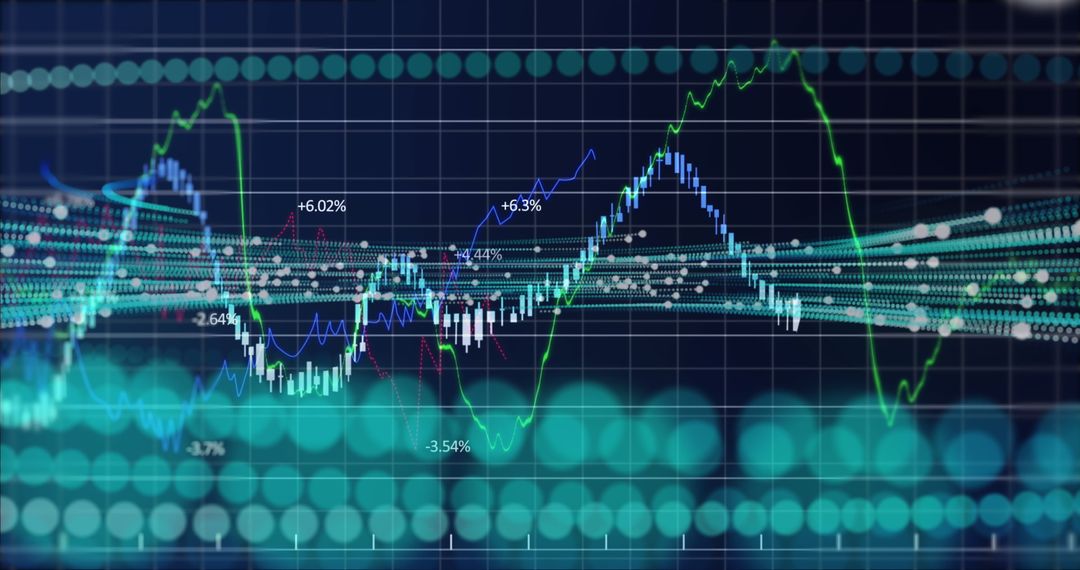
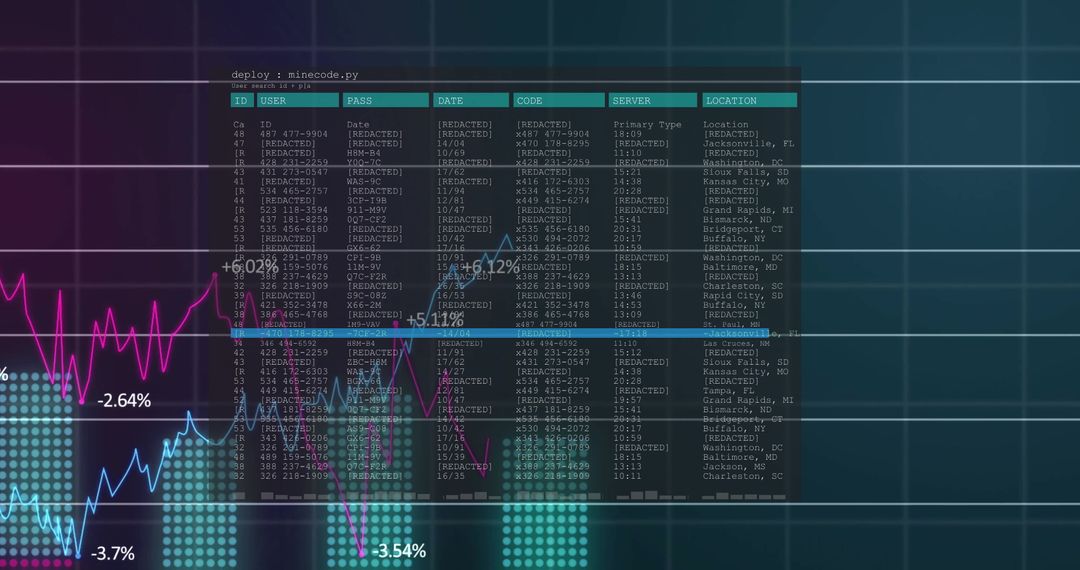
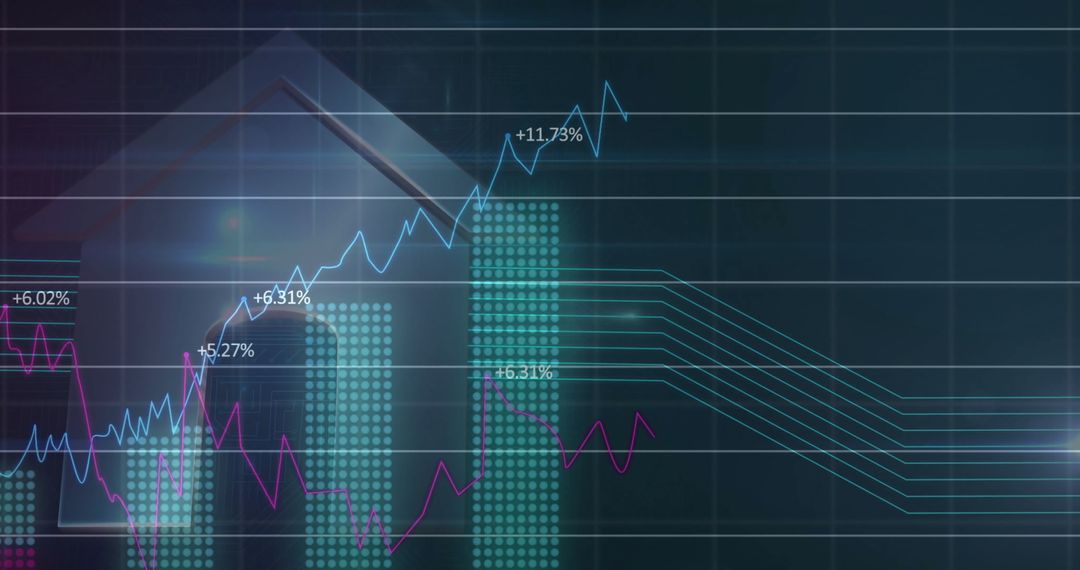
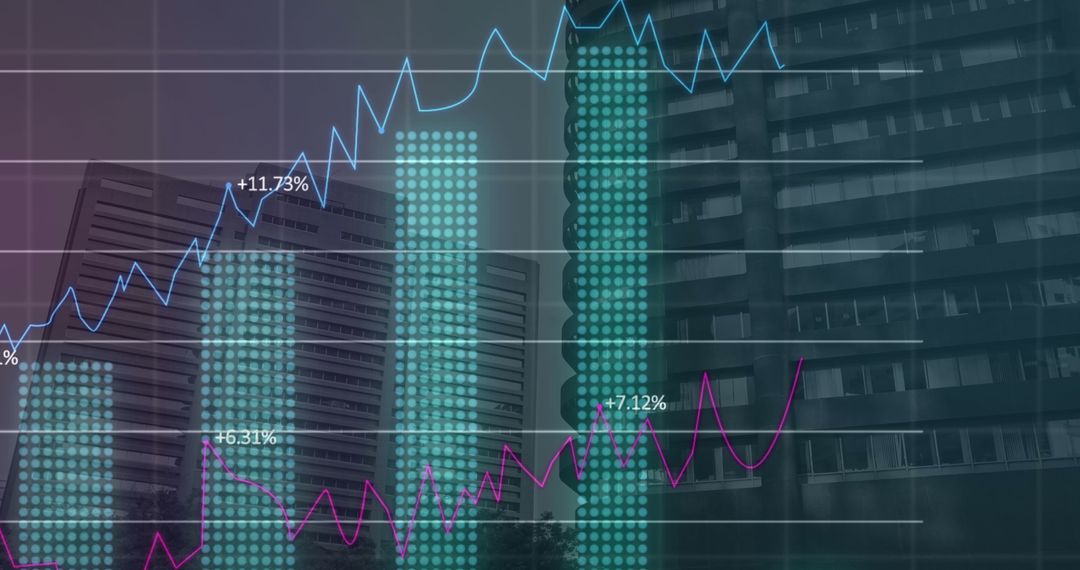
Visualizes integration of human profiles with data analytics, highlighting the intersection of finance and technology. Dark background emphasizes data tracking and user connectivity, making it ideal for illustrating modern economic concepts and tech innovations in digital publications, websites, and presentations.
Powered by 


2
downloads
downloads
Tags:
More
Credit Photo
If you would like to credit the Photo, here are some ways you can do so
Text Link
photo Link
<span class="text-link">
<span>
<a target="_blank" href=https://pikwizard.com/photo/digital-finance-network-with-user-profiles-and-graphs/c64e88aaaba62a81a5b512e4f6fc4922/>PikWizard</a>
</span>
</span>
<span class="image-link">
<span
style="margin: 0 0 20px 0; display: inline-block; vertical-align: middle; width: 100%;"
>
<a
target="_blank"
href="https://pikwizard.com/photo/digital-finance-network-with-user-profiles-and-graphs/c64e88aaaba62a81a5b512e4f6fc4922/"
style="text-decoration: none; font-size: 10px; margin: 0;"
>
<img src="https://pikwizard.com/pw/medium/c64e88aaaba62a81a5b512e4f6fc4922.jpg" style="margin: 0; width: 100%;" alt="" />
<p style="font-size: 12px; margin: 0;">PikWizard</p>
</a>
</span>
</span>
Free (free of charge)
Free for personal and commercial use.
Author: Creative Art
Similar Free Stock Images

Premium


Premium


Premium


Premium


Premium


Premium


Premium


Premium


Premium


Premium


Premium


Premium


Premium


Premium


Premium


Premium


Premium


Premium


Premium


Premium


Premium


Premium


Premium


Premium