- Home >
- Stock Photos >
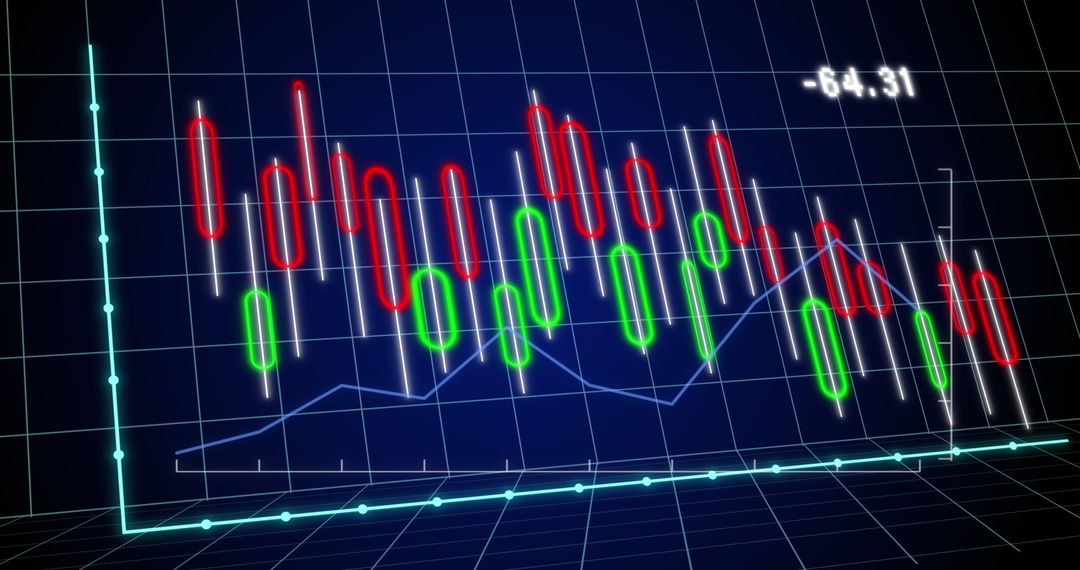
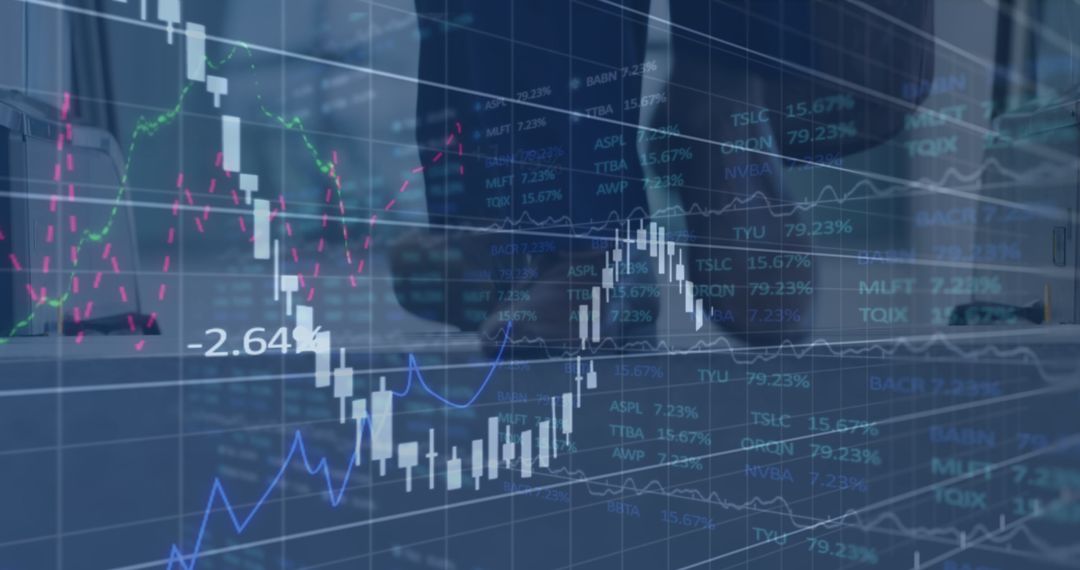
- Digital Financial Analytics Display Screen with Key Metrics
Digital Financial Analytics Display Screen with Key Metrics Image
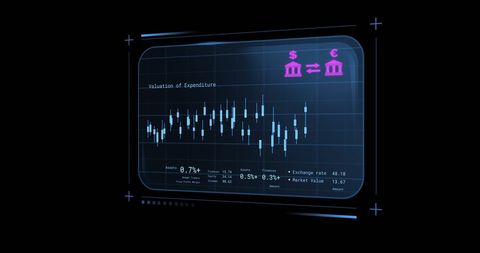
Depicting detailed financial analysis on a digital screen, this visualization showcases critical economic metrics such as exchange rates and expenditure valuation. Ideal for illustrating concepts in finance, banking presentations, business analyses, and economics studies, this material is suited to professionals explaining or exploring modern financial tools and tech-driven assessments.
Powered by 


2
downloads
downloads
Tags:
More
Credit Photo
If you would like to credit the Photo, here are some ways you can do so
Text Link
photo Link
<span class="text-link">
<span>
<a target="_blank" href=https://pikwizard.com/photo/digital-financial-analytics-display-screen-with-key-metrics/8d0508c3ec2073b03ba3e3b0f1b6d198/>PikWizard</a>
</span>
</span>
<span class="image-link">
<span
style="margin: 0 0 20px 0; display: inline-block; vertical-align: middle; width: 100%;"
>
<a
target="_blank"
href="https://pikwizard.com/photo/digital-financial-analytics-display-screen-with-key-metrics/8d0508c3ec2073b03ba3e3b0f1b6d198/"
style="text-decoration: none; font-size: 10px; margin: 0;"
>
<img src="https://pikwizard.com/pw/medium/8d0508c3ec2073b03ba3e3b0f1b6d198.jpg" style="margin: 0; width: 100%;" alt="" />
<p style="font-size: 12px; margin: 0;">PikWizard</p>
</a>
</span>
</span>
Free (free of charge)
Free for personal and commercial use.
Author: People Creations
Similar Free Stock Images

Premium


Premium


Premium


Premium


Premium


Premium


Premium


Premium


Premium


Premium


Premium


Premium


Premium


Premium


Premium


Premium


Premium


Premium


Premium


Premium


Premium


Premium


Premium


Premium