
- Home >
- Stock Photos >
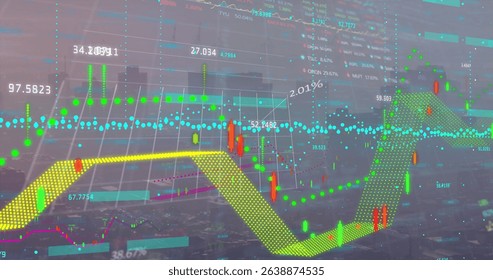
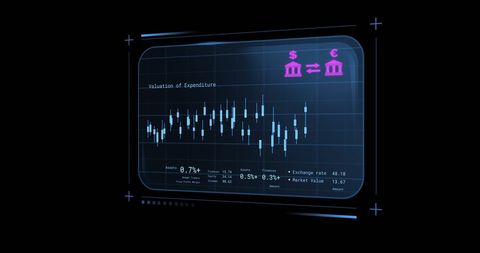
- Digital Financial Analytics Interface with Graphs and Charts
Digital Financial Analytics Interface with Graphs and Charts Image
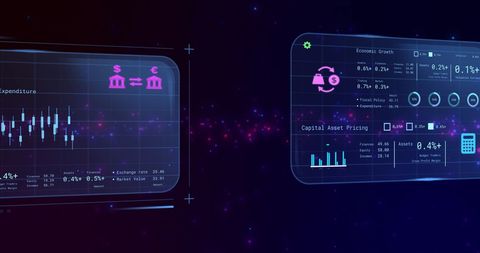
Digital screens displaying financial data, graphs, and charts in a modern analytics interface. Ideal for depicting technology in finance, investment trends, and data innovation. Can be used for business presentations, financial education, or illustrating technological advancements in the finance sector.
Powered by  - Get 15% off with code: PIKWIZARD15


downloads
Tags:
More
Credit Photo
If you would like to credit the Photo, here are some ways you can do so
Text Link
photo Link
<span class="text-link">
<span>
<a target="_blank" href=https://pikwizard.com/photo/digital-financial-analytics-interface-with-graphs-and-charts/165dc84c76b8a2a231c2c1da8e512e6a/>PikWizard</a>
</span>
</span>
<span class="image-link">
<span
style="margin: 0 0 20px 0; display: inline-block; vertical-align: middle; width: 100%;"
>
<a
target="_blank"
href="https://pikwizard.com/photo/digital-financial-analytics-interface-with-graphs-and-charts/165dc84c76b8a2a231c2c1da8e512e6a/"
style="text-decoration: none; font-size: 10px; margin: 0;"
>
<img src="https://pikwizard.com/pw/medium/165dc84c76b8a2a231c2c1da8e512e6a.jpg" style="margin: 0; width: 100%;" alt="" />
<p style="font-size: 12px; margin: 0;">PikWizard</p>
</a>
</span>
</span>
Free (free of charge)
Free for personal and commercial use.
Author: Authentic Images
Similar Free Stock Images

Premium


Premium


Premium

Premium


Premium


Premium


Premium


Premium

Premium


Premium


Premium


Premium

Premium


Premium


Premium


Premium


Premium


Premium


Premium


Premium


Premium


Premium


Premium


Premium

Premium


Explore More Free Stock Images