- Home >
- Stock Photos >
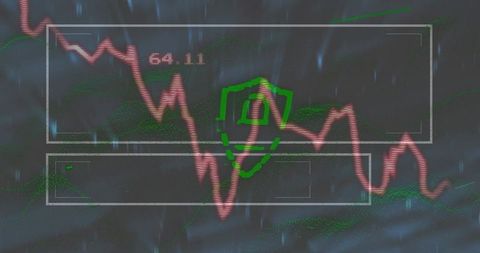
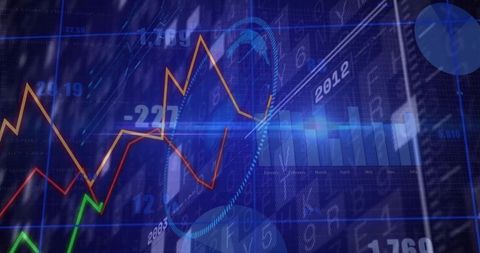
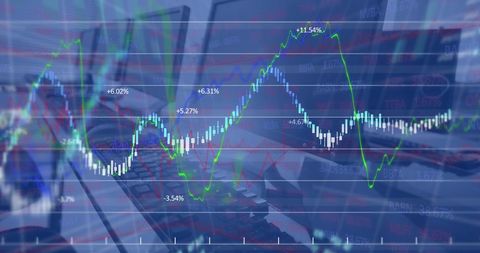
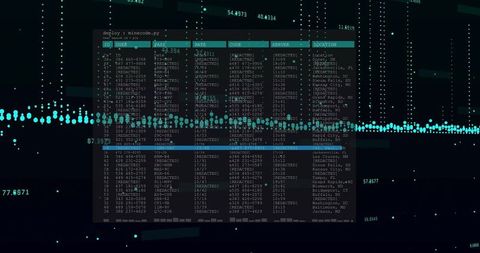
- Digital Financial Analytics with Candlestick Chart Overlay
Digital Financial Analytics with Candlestick Chart Overlay Image

Candlestick chart on a digital trading platform showcasing real-time financial analytics and investment data. Incorporates dotted grid lines and numeric labeling for accurate data tracking. Ideal for articles or resources related to digital finance, technology in business, and the stock market. Suitable for visual presentations in reports about trading or growth analysis of investments.

downloads
Tags:
More
Credit Photo
If you would like to credit the Photo, here are some ways you can do so
Text Link
photo Link
<span class="text-link">
<span>
<a target="_blank" href=https://pikwizard.com/photo/digital-financial-analytics-with-candlestick-chart-overlay/b5cc0b1c91a36b987094d87ea3c604c0/>PikWizard</a>
</span>
</span>
<span class="image-link">
<span
style="margin: 0 0 20px 0; display: inline-block; vertical-align: middle; width: 100%;"
>
<a
target="_blank"
href="https://pikwizard.com/photo/digital-financial-analytics-with-candlestick-chart-overlay/b5cc0b1c91a36b987094d87ea3c604c0/"
style="text-decoration: none; font-size: 10px; margin: 0;"
>
<img src="https://pikwizard.com/pw/medium/b5cc0b1c91a36b987094d87ea3c604c0.jpg" style="margin: 0; width: 100%;" alt="" />
<p style="font-size: 12px; margin: 0;">PikWizard</p>
</a>
</span>
</span>
Free (free of charge)
Free for personal and commercial use.
Author: People Creations