- Home >
- Stock Photos >
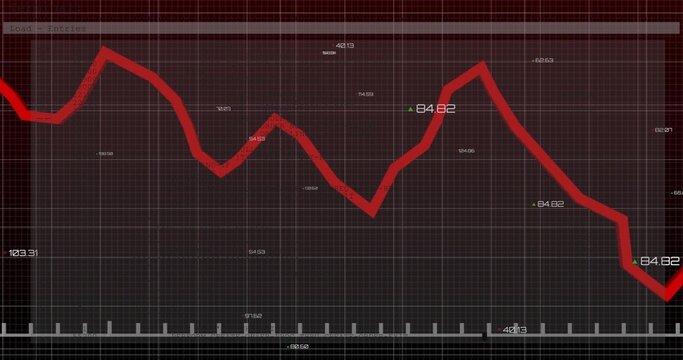
- Digital Financial Analytics with Red Trends on Grid Screen
Digital Financial Analytics with Red Trends on Grid Screen Image

Dark grid screen with fluctuating red trend line makes a bold look. Waveform lines in multiple colors visualize financial market paths and analytics, representing constantly changing stock market status and investment analysis. This graphic serves well for financial presentations, illustrating trends, data reports, or in blog articles discussing market strategies and economic shifts.
Powered by 


0
downloads
downloads
Tags:
More
Credit Photo
If you would like to credit the Photo, here are some ways you can do so
Text Link
photo Link
<span class="text-link">
<span>
<a target="_blank" href=https://pikwizard.com/photo/digital-financial-analytics-with-red-trends-on-grid-screen/7bf259be2a0536095e32465346bb015c/>PikWizard</a>
</span>
</span>
<span class="image-link">
<span
style="margin: 0 0 20px 0; display: inline-block; vertical-align: middle; width: 100%;"
>
<a
target="_blank"
href="https://pikwizard.com/photo/digital-financial-analytics-with-red-trends-on-grid-screen/7bf259be2a0536095e32465346bb015c/"
style="text-decoration: none; font-size: 10px; margin: 0;"
>
<img src="https://pikwizard.com/pw/medium/7bf259be2a0536095e32465346bb015c.jpg" style="margin: 0; width: 100%;" alt="" />
<p style="font-size: 12px; margin: 0;">PikWizard</p>
</a>
</span>
</span>
Free (free of charge)
Free for personal and commercial use.
Author: Creative Art
Similar Free Stock Images

Premium


Premium


Premium


Premium


Premium


Premium


Premium


Premium


Premium


Premium


Premium


Premium


Premium


Premium


Premium


Premium


Premium


Premium


Premium


Premium


Premium


Premium


Premium


Premium