1. Home > 
  2. Stock Photos > 
  3. Digital Financial Analytics with Rising Graphs and Data Overlays

Digital Financial Analytics with Rising Graphs and Data Overlays Image

Digital Financial Analytics with Rising Graphs and Data Overlays

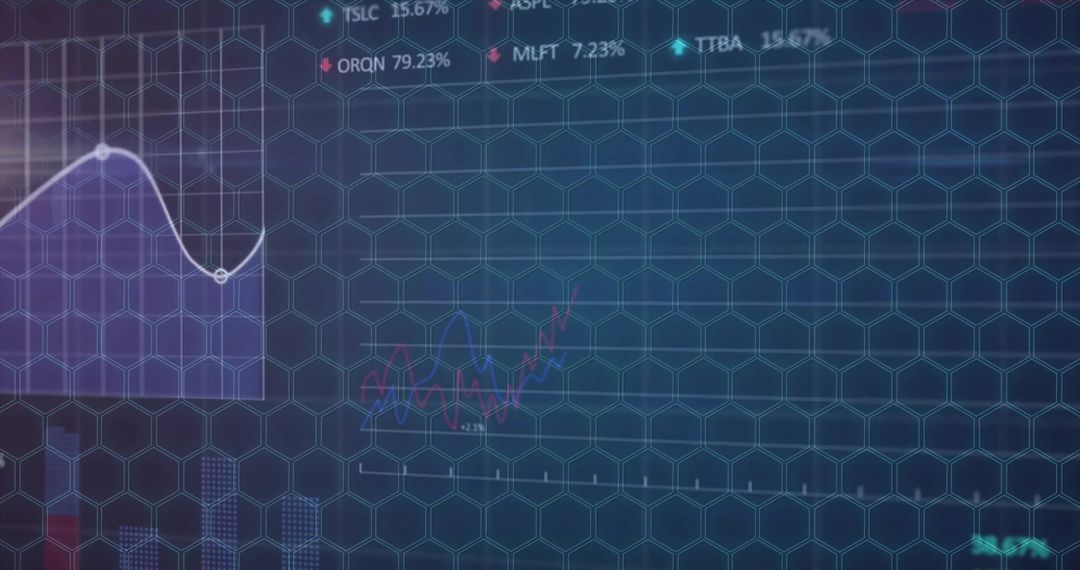
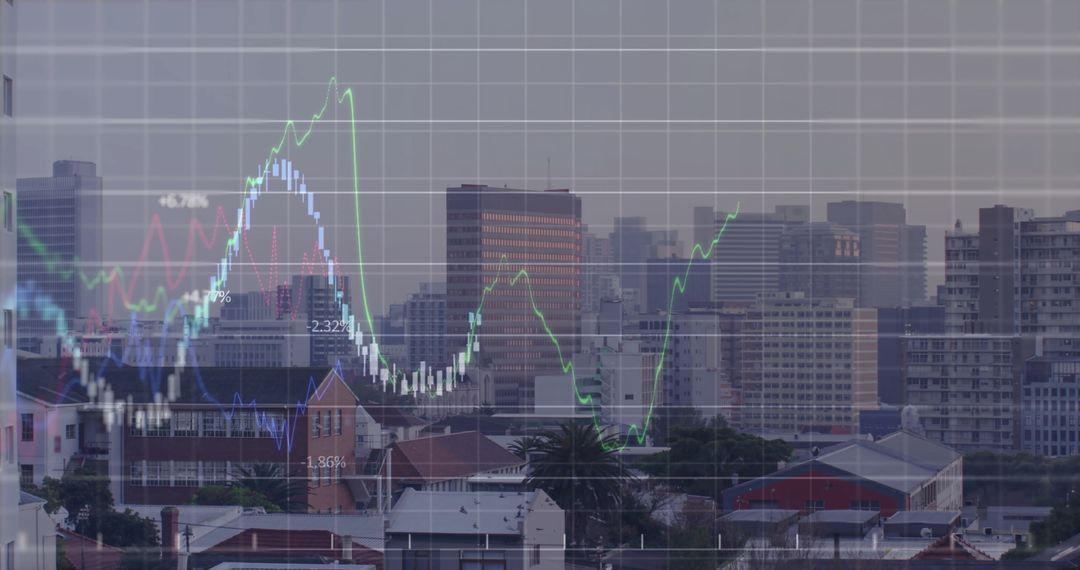
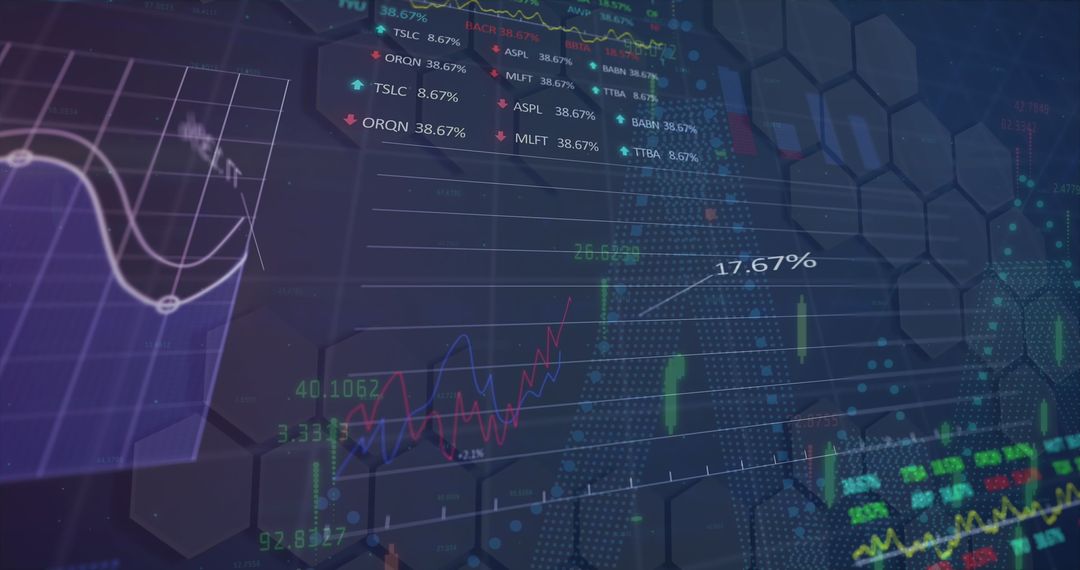
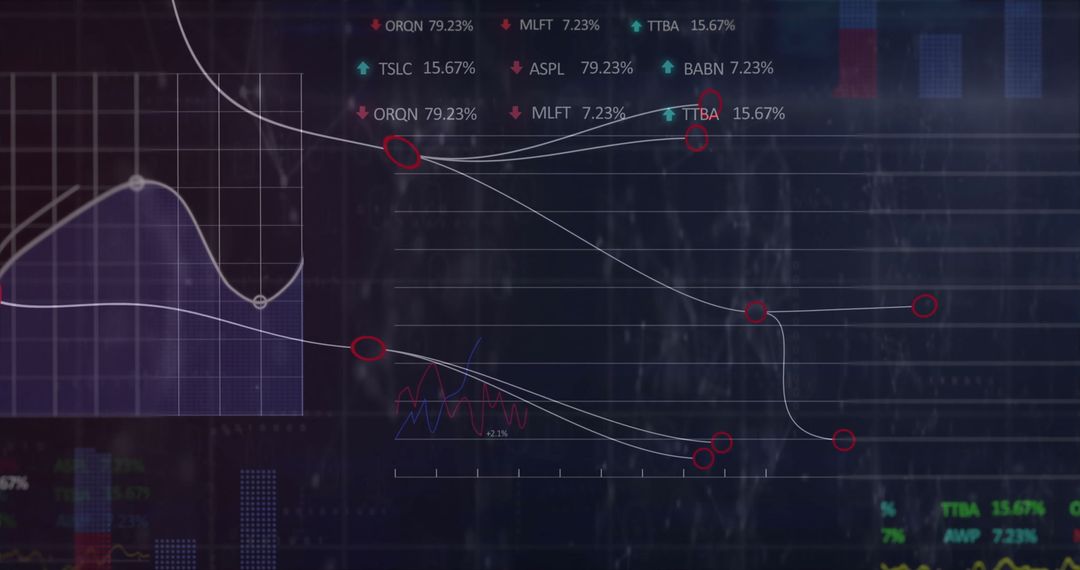
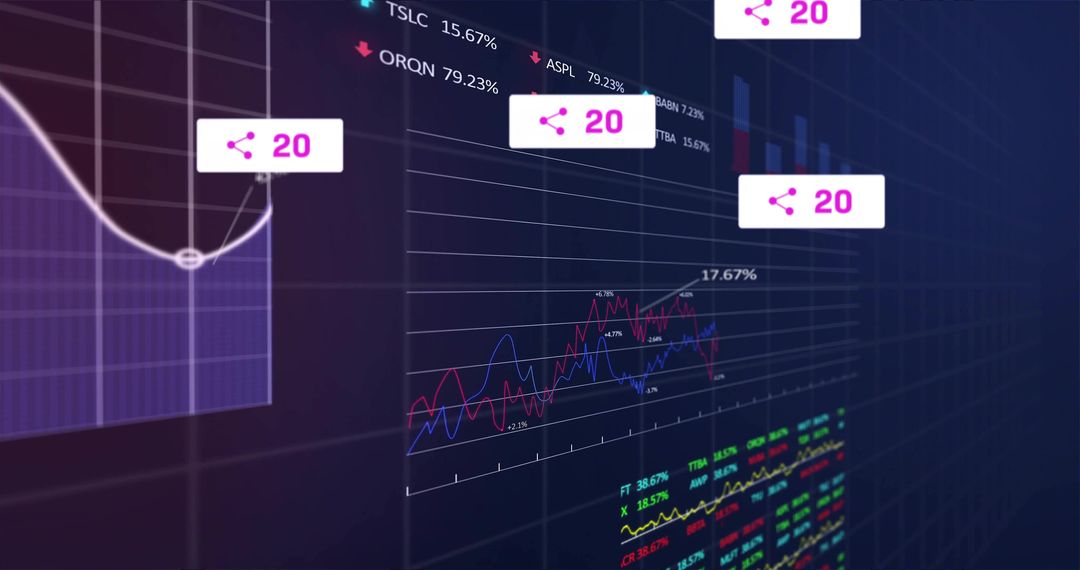
This image depicts a dynamic digital background showcasing financial data analytics with graphs, binary code, and market trends. Charts and statistics evoke themes of global finance, investments, and data-driven decision-making. Suitable for illustrating financial reports, business websites, stock market analyses, or technology in economic forecasting. Ideal for presentations and articles emphasizing economic growth and analytics tools.

Powered by Adobe logo
Businesswoman working on laptop with digital data charts and analytics dashboard overlay, representing business intelligence, data analysis, financial reports, and modern technology solutions. - Powered by AdobeA close-up, macro shot of a black pen tip touching a red line on a digital screen displaying stock market data with green and orange glowing elements and bokeh - Powered by AdobeGlowing upward arrow graph made of digital particles, symbolizing growth and success on a dark background with bokeh lights. - Powered by AdobeAfrican American businessman analyzing financial data and market trends on digital tablet screen, close up view of hands touching interactive charts. - Powered by AdobeBusiness professionals collaborating and analyzing financial data on a laptop with charts and graphs during a meeting - Powered by Adobe

Credit Photo

If you would like to credit the Photo, here are some ways you can do so

Free (free of charge)

Free for personal and commercial use.

Author: Creative Art

Similar Free Stock Images

Financial Data and Graphs on Digital Screen
Premium
Futuristic bar graph on tablet symbolizing growth and success in the digital age
Global Finance Technology Vision over Digital Map
Global Stock Market Data Flow with Digital Interface
Digital Financial Data Analytics Wand Big Affect SEO Tools Commercial
Financial Graphs with Cityscape Background Reflecting Market Trends
Premium
Data analytics and big data strategy for real-time analytics, predictive data modeling, business intelligence analytics, and data-driven decision-making in modern digital businesses. Thunk
Data Processing and Cloud Computing Server Room Visualization
Financial Data Overlay on Urban Skyscrapers
Futuristic Global Business and Data Interface Concept
Digital Financial Data and Statistics Analyzing Concept
Premium
Magnifying glass focusing on a vibrant financial data chart
Digital Stock Market Graph Displaying Financial Trends
Futuristic Data Chart with Digital Interface Elements
Digital Security in Global Finance Data Analysis
Dynamic Financial Data with Global Connections and Insights
Premium
Digital sales performance dashboard showing sales performance metrics, performance trends, sales performance analytics, and sales improvement in business context. Muxer
Colorful Data Analytics Display on Dark Background
Abstract Landscape with Financial Data and Global Connections
Financial Data Graphic with Rising Trends on Digital Grid
Digital Financial Data and Binary Code Overlay
Premium
Businesswoman typing on laptop with digital financial chart overlay, representing data analysis, stock market trends, economic growth, investment, business strategy, and modern technology.
Financial Data Overlay on Environmental Pollution Concept
Digital Financial Analytics Interface with Stock Tickers
Digital trading screen with rising charts and data analytics
NFT Trading Analytics Dashboard with Graphs and Data Metrics
Premium
Finance analyst working on business analytics and data management system to make financial report with business performance, KPI dashboard. Corporate strategy for finance, digital marketing plan
Futuristic Financial Trading Dashboard with Data Analytics Visualization
Futuristic Green Pound Symbol Amid Financial Data Charts
Futuristic Streaming Analytics Dashboard with Data Visualization
Rising Candlestick Chart on Dynamic Digital Financial Display
Colorful Stock Market Display with Graphs and Tickers on Blue Background
Abstract Financial Data and Numbers in Virtual Environment
Premium
Financial data graph with rising and falling trends in vibrant colors
Dynamic Stock Market and Financial Data Analysis Concept
Financial Visualization Overlooking Urban Cityscape
Abstract Financial Graphs Overlapping Urban Skyline
Dynamic Financial Data and Graphs on Digital Interface
Premium
Data analyzing and stock market visualization with digital charts, financial dashboards, and performance metrics. Ideal for investment analysis, trading strategy, and economic forecasting.
Digital Data Analytics Display with Global Business Interface
Financial Data Visualization in Server Room Setting
Stock Market Data Visuals Displaying Financial Analysis Trends
Futuristic Digital Finance Interface with Technology Elements
Premium
Laptop screen displaying financial data charts.
Soundwaves with Graph Overlays in Data Processing Concept
Digital Charts Highlighting Global Finance Data Insights
Digital Data and Analytics Representation in Futuristic Environment
Digital Financial Graphs and Business Analytics on Blue Backdrop
Premium
Abstract futuristic technology background with glowing lines charts and data visualization
Digital Financial Data Analysis on Abstract Blue Background
Financial Data Charts with Viewing Grid in Dark Perspective
Abstract Digital Financial Data Graph Chart
Financial Data Processing on Digital Graph Displayed on Screen
Premium
Businessman analyzing financial data with tablet and writing notes, futuristic analytics concept with digital graph overlay in modern office interior.
Financial Analysis with Percentage Shifts on Digital Trading Screen
Abstract Financial Chart with Growing Cryptocurrency Trends
Dynamic Digital Financial Chart with Market Trends and Data Analysis
Business Analyst Interpreting Complex Data Visualizations on Large Displays
Premium
Diverse team analyzing complex financial data and charts on a large digital screen
Futuristic Data Analytics Dashboard with Bar and Trend Charts
3D Financial Chart with Candlestick Bars and Trend Lines
Futuristic Holographic Interface with Data Analytics and Binary Code
Futuristic Financial Data and Digital Network Interface
Futuristic Digital Interface with City Overlay and Data Graphs
Data Processing and Statistics Visualization in Server Room
Premium
Hand pointing at a world map with stock market charts and data overlays indicating global financial activity
Dynamic Financial Data Displayed Over Cityscape Background
Digital Ruble Symbol with Data Graph Overlay
Financial Data Display in Digital Grid Design
Financial Data Processing with Global Business Analytics
Premium
A professional analyzing financial data using a digital tablet with dynamic charts and graphs.
Abstract Financial Market Data with CGI and Code Overlay
Global Stock Trading Concepts with Dynamic Data Visualizations
Dynamic Financial Graphs on Digital Screen Displaying Market Trends
Finance and Technology Theme with Stock Market Data Overlay
Premium
Retail store displaying futuristic data analytics interface
Financial Growth Chart with Digital Data Interface
Financial Data Visualization in Modern Server Room
Futuristic Technology Interface with Chart Visualizations
Abstract Financial Chart Showing Upward Trend in Global Market
Premium
Orange financial charts over city skyline at sunset stock market trading
Digital Data Visualization Overlaying Sports Stadium
Dynamic Financial Graph with Data Analysis Conceptual Background
Financial Data Analysis with Detailed Stock Chart Visual
Financial Data Visualization with Mobile Payment Concept
Premium
Futuristic digital graph displayed on a tablet, symbolizing financial growth and business analytics in a technological context.
Dynamic Financial Graphs and Dashboard Analytics
Futuristic Data Analysis Grid with Trend Lines and Markers
Financial Chart Overlay on City Skyline with Line Graphs
City Skyline with Financial Data Visualization Overlay
Premium
Global finance concept with stacked coins, digital world map and rising bar charts symbolizing economic growth, currency markets, international investment and modern financial analytics.
Digital Analytics Dashboard with Charts and Percent Metrics
Abstract data dashboard visualizing analytics with pulsing avatar icon and HUD elements
Financial Data and Stock Market Analysis with Digital Overlay
Abstract Digital Financial Data with Graphs and Charts
Digital Financial Data Analyzing with Bar and Line Graphs on Screen
Global Financial Data and Analytics Overlay
Premium
Businessman analyzing financial data on futuristic digital screen with graphs and charts on a dark background, showcasing the finance growth concept.
Dynamic Financial Charts with Blue Digital Interface
Abstract Overlay of Statistical Data on Urban Buildings
Digital Interface of Data Processing Over Cityscape
Digital Data Visualization with Futuristic Infographics
Premium
The dynamic financial graph overlaying a vibrant urban skyline at night.
Financial Graphs Overlaying Cityscape Illustrate Global Economy
Digital Graphs Display Financial Stock Market Data Trends Analysis
Digital Stock Market Analysis With City Background
Digital Soundwaves with Data Graphs and Coding Elements
Premium
Businesswoman analyzing holographic financial data with smart glasses
Global Financial Data Overlay with Coding Elements
Financial Data Processing in Digital Environment
Global Financial Data Analysis with Dynamic Graphs on World Map
Futuristic Stock Market Graphs on Digital Display
Premium
Typing on a glowing laptop with emerging data graphs for business analysis and financial planning in the digital age concept
Stock Market Data Analysis with Futuristic Digital Interface
Digital Interface with Data Processing and Analytics Charts
Futuristic Data Visualization with Binary Code and Graph Elements
Dynamic Financial Data Graph Illustrating Stock Market Trends
Premium
Isometric data analytics platform with a growing bar chart. Digital technology and business intelligence concept for financial growth.
Selective Data Points on Dark Analytics Dashboard with Sleek Design
Financial Data Overlay on Office Desk with Visible Growth Chart
Dynamic Stock Market Dashboard with Graph and Charts
Digital Financial Data Analysis with Share Icons
Premium
Man working on laptop with orange holographic charts in a futuristic office environment setting
Neon finance analytics dashboard streaming binary code with volatile line charts