- Home >
- Stock Photos >
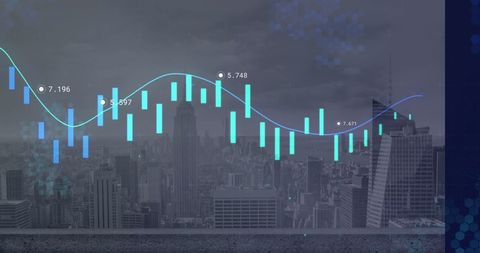
- Digital Financial Data Analysis Interface with Graphs and Metrics
Digital Financial Data Analysis Interface with Graphs and Metrics Image

The design features abstract digital interface displaying financial data with colorful graphs and numerical markers. Ideal for use in advertising technology in finance, promoting financial software, or illustrating stat-based discussions in economics and business presentations.

downloads
Tags:
More
Credit Photo
If you would like to credit the Photo, here are some ways you can do so
Text Link
photo Link
<span class="text-link">
<span>
<a target="_blank" href=https://pikwizard.com/photo/digital-financial-data-analysis-interface-with-graphs-and-metrics/0944ee5eb8d2386d401099940944a4ab/>PikWizard</a>
</span>
</span>
<span class="image-link">
<span
style="margin: 0 0 20px 0; display: inline-block; vertical-align: middle; width: 100%;"
>
<a
target="_blank"
href="https://pikwizard.com/photo/digital-financial-data-analysis-interface-with-graphs-and-metrics/0944ee5eb8d2386d401099940944a4ab/"
style="text-decoration: none; font-size: 10px; margin: 0;"
>
<img src="https://pikwizard.com/pw/medium/0944ee5eb8d2386d401099940944a4ab.jpg" style="margin: 0; width: 100%;" alt="" />
<p style="font-size: 12px; margin: 0;">PikWizard</p>
</a>
</span>
</span>
Free (free of charge)
Free for personal and commercial use.
Author: Awesome Content