
- Home >
- Stock Photos >
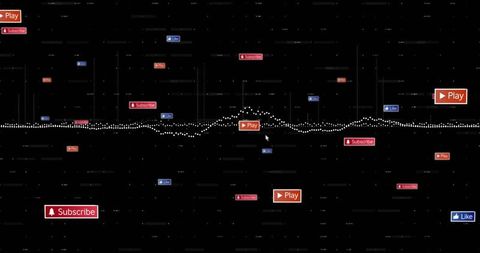
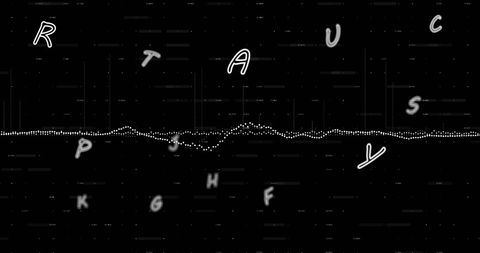
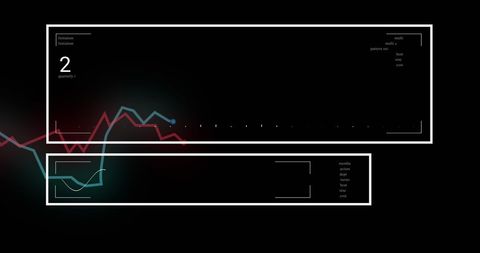
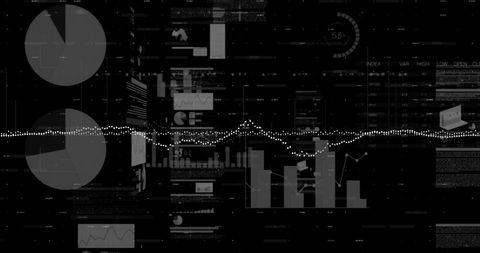
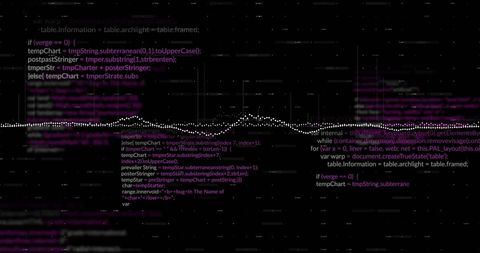
- Digital Financial Data Analysis with Glowing Background
Digital Financial Data Analysis with Glowing Background Image

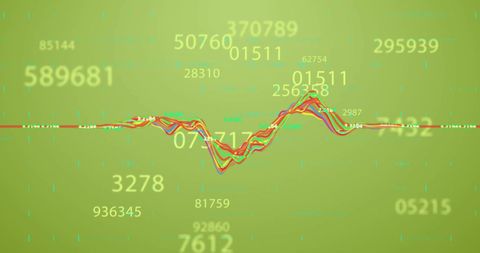
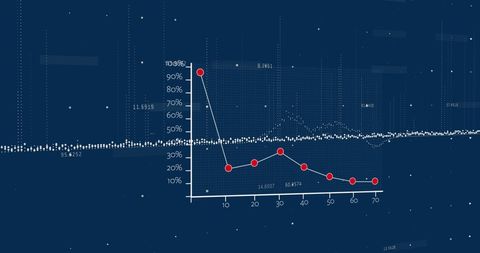
Depicts digital financial data processing in a dynamic layout with glowing elements. Ideal for illustrating themes of global finance, business analytics, or innovative data technology services. Useful for websites, promotional content, or articles on data connectivity and technological advancements.
Powered by 


downloads
Tags:
More
Credit Photo
If you would like to credit the Photo, here are some ways you can do so
Text Link
photo Link
<span class="text-link">
<span>
<a target="_blank" href=https://pikwizard.com/photo/digital-financial-data-analysis-with-glowing-background/fe9e813bde552bfd01e3745628aa8ddc/>PikWizard</a>
</span>
</span>
<span class="image-link">
<span
style="margin: 0 0 20px 0; display: inline-block; vertical-align: middle; width: 100%;"
>
<a
target="_blank"
href="https://pikwizard.com/photo/digital-financial-data-analysis-with-glowing-background/fe9e813bde552bfd01e3745628aa8ddc/"
style="text-decoration: none; font-size: 10px; margin: 0;"
>
<img src="https://pikwizard.com/pw/medium/fe9e813bde552bfd01e3745628aa8ddc.jpg" style="margin: 0; width: 100%;" alt="" />
<p style="font-size: 12px; margin: 0;">PikWizard</p>
</a>
</span>
</span>
Free (free of charge)
Free for personal and commercial use.
Author: People Creations
Similar Free Stock Images
Premium


Premium


Premium

Premium


Premium


Premium

Premium

Premium


Premium


Premium

Premium


Premium


Premium

Premium


Premium

Premium

Premium


Premium


Premium


Premium


Premium


Premium


Premium

Premium


Premium

Explore More Free Stock Images