
- Home >
- Stock Photos >
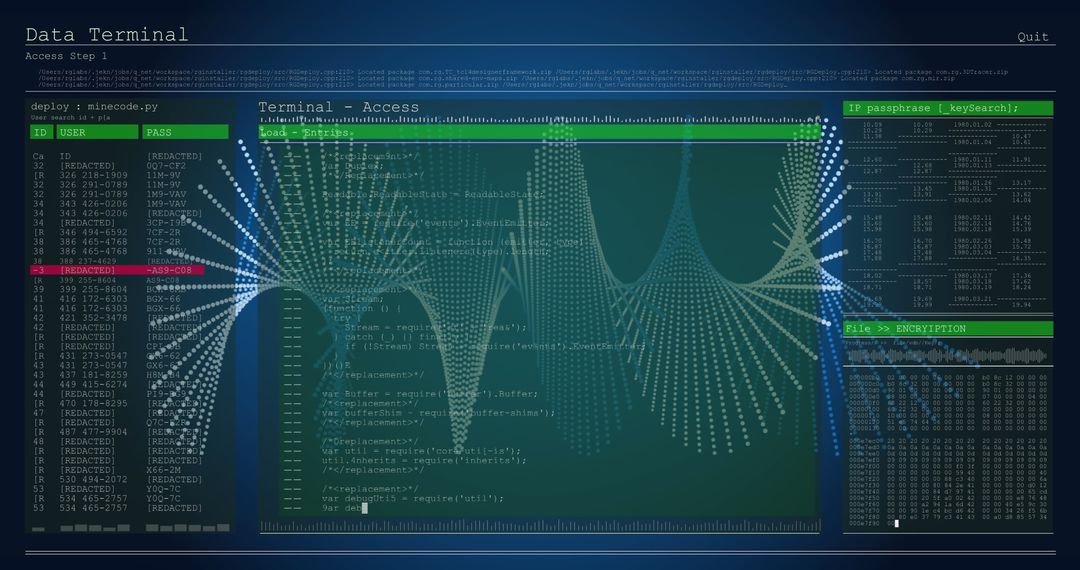
- Digital Financial Data Analysis with Graphs and Stock Market Trends
Digital Financial Data Analysis with Graphs and Stock Market Trends Image

Complex overlay of financial graphs and numerical data portraying stock market analysis. Use for highlighting advancements in economic technology, financial forecasting, and investment strategies, particularly suited for articles, presentations, and reports related to finance and data analytics.
Powered by  - Get 15% off with code: PIKWIZARD15


8
downloads
downloads
Tags:
More
Credit Photo
If you would like to credit the Photo, here are some ways you can do so
Text Link
photo Link
<span class="text-link">
<span>
<a target="_blank" href=https://pikwizard.com/photo/digital-financial-data-analysis-with-graphs-and-stock-market-trends/d7e188e963111d4a57b70ebcffcaee3c/>PikWizard</a>
</span>
</span>
<span class="image-link">
<span
style="margin: 0 0 20px 0; display: inline-block; vertical-align: middle; width: 100%;"
>
<a
target="_blank"
href="https://pikwizard.com/photo/digital-financial-data-analysis-with-graphs-and-stock-market-trends/d7e188e963111d4a57b70ebcffcaee3c/"
style="text-decoration: none; font-size: 10px; margin: 0;"
>
<img src="https://pikwizard.com/pw/medium/d7e188e963111d4a57b70ebcffcaee3c.jpg" style="margin: 0; width: 100%;" alt="" />
<p style="font-size: 12px; margin: 0;">PikWizard</p>
</a>
</span>
</span>
Free (free of charge)
Free for personal and commercial use.
Author: People Creations
Similar Free Stock Images

Premium


Premium


Premium


Premium


Premium


Premium


Premium


Premium


Premium


Premium


Premium


Premium


Premium


Premium


Premium


Premium


Premium


Premium


Premium


Premium


Premium


Premium


Premium


Premium

