
- Home >
- Stock Photos >
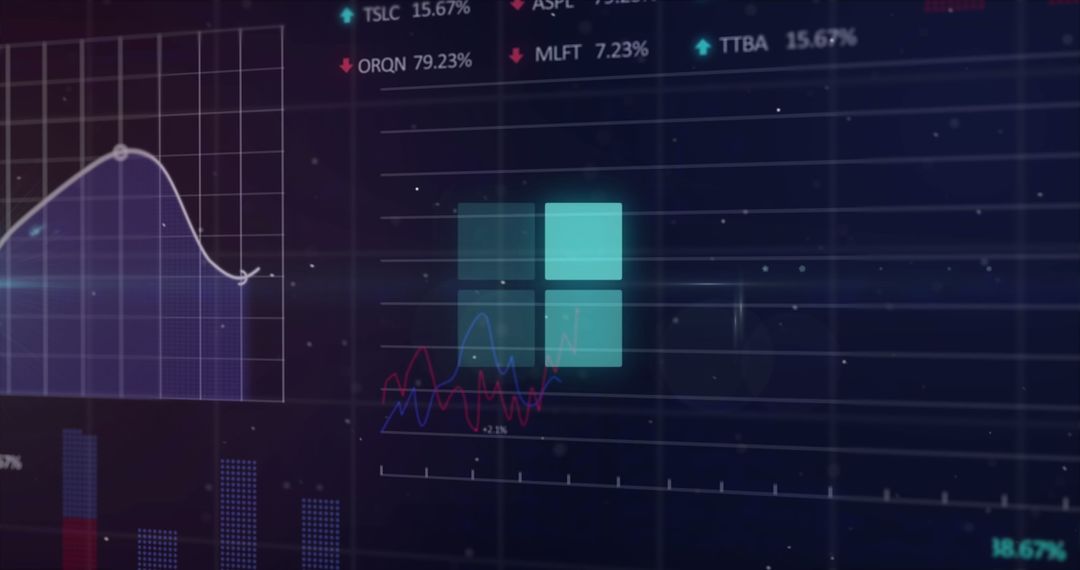
- Digital Financial Data Analytics Wand Big Affect SEO Tools Commercial
Digital Financial Data Analytics Wand Big Affect SEO Tools Commercial Image

Futuristic visualization of financial data with glowing graphs and binary code background. Suitable for presentations and articles on global finance trends, data analytics technology, and stock market insights. Ideal for visually engaging content that explores the intersection of digital economy and technology.
Powered by  - Get 15% off with code: PIKWIZARD15


2
downloads
downloads
Tags:
More
Credit Photo
If you would like to credit the Photo, here are some ways you can do so
Text Link
photo Link
<span class="text-link">
<span>
<a target="_blank" href=https://pikwizard.com/photo/digital-financial-data-analytics-wand-big-affect-seo-tools-commercial/6cdf097100bfeee683dbce55afb1d6db/>PikWizard</a>
</span>
</span>
<span class="image-link">
<span
style="margin: 0 0 20px 0; display: inline-block; vertical-align: middle; width: 100%;"
>
<a
target="_blank"
href="https://pikwizard.com/photo/digital-financial-data-analytics-wand-big-affect-seo-tools-commercial/6cdf097100bfeee683dbce55afb1d6db/"
style="text-decoration: none; font-size: 10px; margin: 0;"
>
<img src="https://pikwizard.com/pw/medium/6cdf097100bfeee683dbce55afb1d6db.jpg" style="margin: 0; width: 100%;" alt="" />
<p style="font-size: 12px; margin: 0;">PikWizard</p>
</a>
</span>
</span>
Free (free of charge)
Free for personal and commercial use.
Author: Creative Art
Similar Free Stock Images

Premium


Premium


Premium


Premium


Premium


Premium


Premium


Premium


Premium


Premium


Premium


Premium


Premium


Premium


Premium


Premium


Premium


Premium


Premium


Premium


Premium


Premium


Premium


Premium

