- Home >
- Stock Photos >
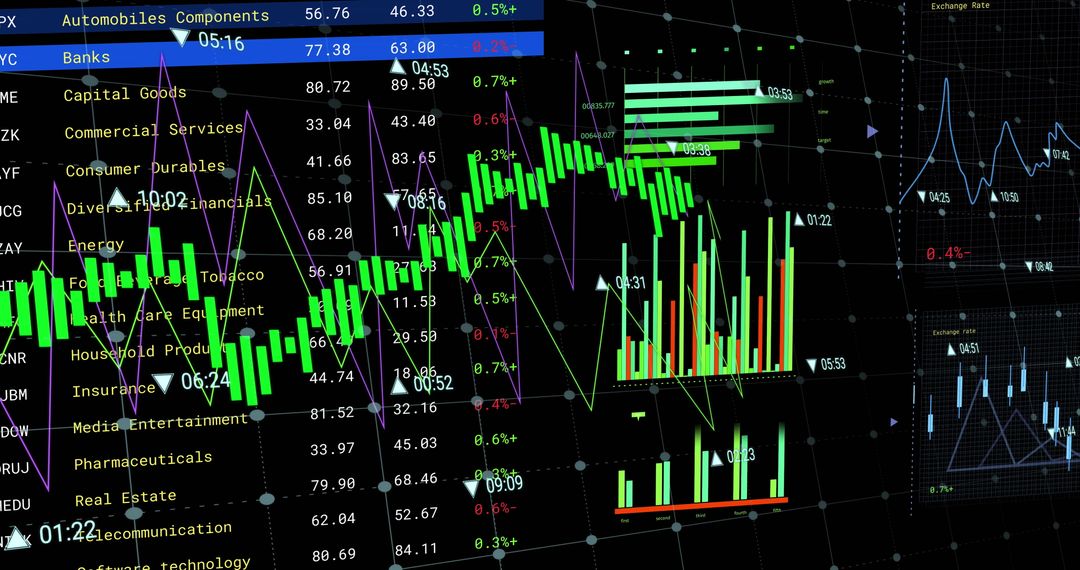
- Digital Financial Data Analyzing with Bar and Line Graphs on Screen
Digital Financial Data Analyzing with Bar and Line Graphs on Screen Image

Digital charts displaying diverse financial data including bar and line graphs symbolize modern financial analysis and strategy. This design is ideal for illustrating articles, reports, or presentations about investments, business growth, or economic data analysis, making complex data visualization accessible and engaging globally.
Powered by  - Get 15% off with code: PIKWIZARD15


2
downloads
downloads
Tags:
More
Credit Photo
If you would like to credit the Photo, here are some ways you can do so
Text Link
photo Link
<span class="text-link">
<span>
<a target="_blank" href=https://pikwizard.com/photo/digital-financial-data-analyzing-with-bar-and-line-graphs-on-screen/f75bb3c064a86e36392cbe87078cc60a/>PikWizard</a>
</span>
</span>
<span class="image-link">
<span
style="margin: 0 0 20px 0; display: inline-block; vertical-align: middle; width: 100%;"
>
<a
target="_blank"
href="https://pikwizard.com/photo/digital-financial-data-analyzing-with-bar-and-line-graphs-on-screen/f75bb3c064a86e36392cbe87078cc60a/"
style="text-decoration: none; font-size: 10px; margin: 0;"
>
<img src="https://pikwizard.com/pw/medium/f75bb3c064a86e36392cbe87078cc60a.jpg" style="margin: 0; width: 100%;" alt="" />
<p style="font-size: 12px; margin: 0;">PikWizard</p>
</a>
</span>
</span>
Free (free of charge)
Free for personal and commercial use.
Author: Awesome Content
Similar Free Stock Images

Premium


Premium


Premium


Premium


Premium


Premium


Premium


Premium


Premium


Premium


Premium


Premium


Premium


Premium


Premium


Premium


Premium


Premium


Premium


Premium


Premium


Premium


Premium


Premium