
- Home >
- Stock Photos >
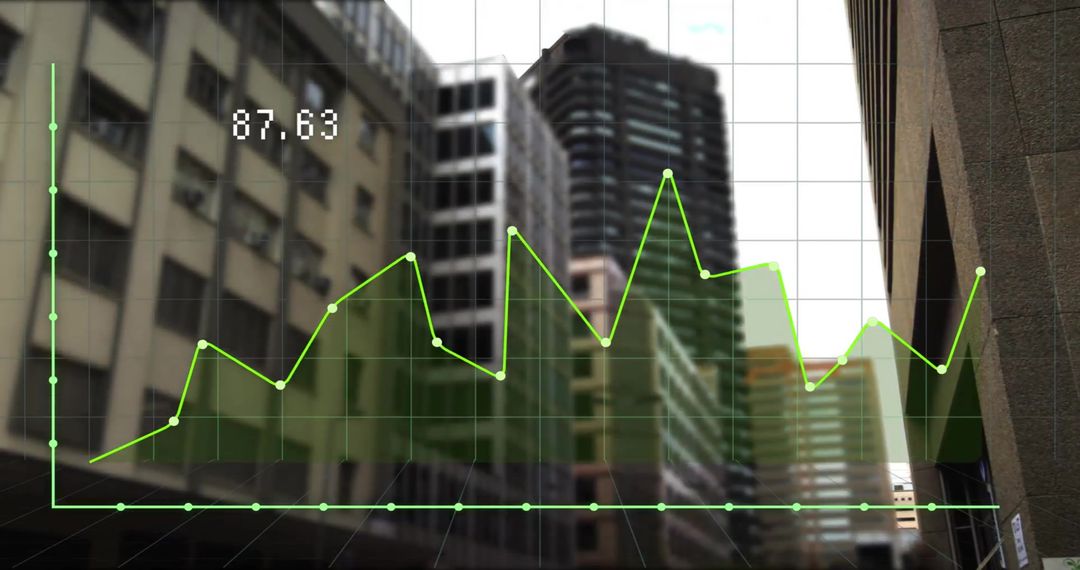
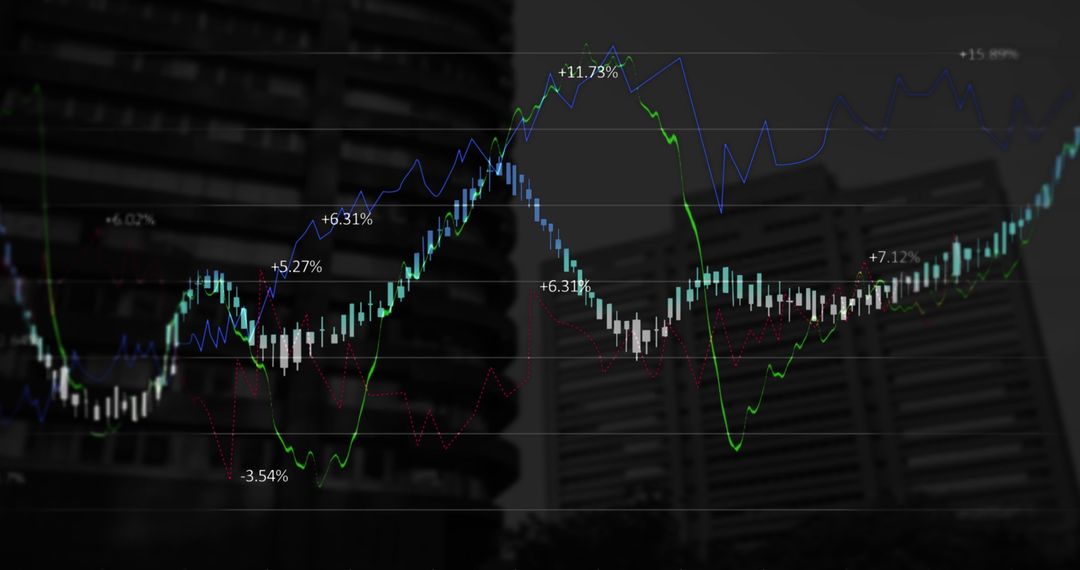
- Digital Financial Data Chart with Modern City Skyscrapers
Digital Financial Data Chart with Modern City Skyscrapers Image

Red line graph prominently displayed against backdrop of modern office buildings, symbolizing financial market trends in urban financial district. Useful for illustrating topics related to the stock market, financial analysis, economic strategies, or business news segments. Can support visual storytelling in presentations about financial performance or economic forecasts.
Powered by  - Get 15% off with code: PIKWIZARD15


2
downloads
downloads
Tags:
More
Credit Photo
If you would like to credit the Photo, here are some ways you can do so
Text Link
photo Link
<span class="text-link">
<span>
<a target="_blank" href=https://pikwizard.com/photo/digital-financial-data-chart-with-modern-city-skyscrapers/4650820a1aabfb73d0186a4a65bec0cb/>PikWizard</a>
</span>
</span>
<span class="image-link">
<span
style="margin: 0 0 20px 0; display: inline-block; vertical-align: middle; width: 100%;"
>
<a
target="_blank"
href="https://pikwizard.com/photo/digital-financial-data-chart-with-modern-city-skyscrapers/4650820a1aabfb73d0186a4a65bec0cb/"
style="text-decoration: none; font-size: 10px; margin: 0;"
>
<img src="https://pikwizard.com/pw/medium/4650820a1aabfb73d0186a4a65bec0cb.jpg" style="margin: 0; width: 100%;" alt="" />
<p style="font-size: 12px; margin: 0;">PikWizard</p>
</a>
</span>
</span>
Free (free of charge)
Free for personal and commercial use.
Author: People Creations
Similar Free Stock Images

Premium


Premium


Premium


Premium


Premium


Premium


Premium


Premium


Premium


Premium


Premium


Premium


Premium


Premium


Premium


Premium


Premium


Premium


Premium


Premium


Premium


Premium


Premium


Premium

