
- Home >
- Stock Photos >
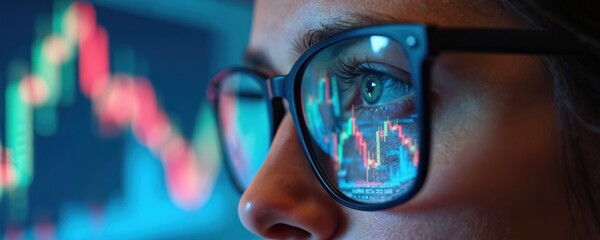
- Digital Financial Data Display Tracking Market Trends
Digital Financial Data Display Tracking Market Trends Image

Illustrating digital financial data with charts and graphs, this scene can be used in articles and posts related to market analysis, global economic forecasts, and investor strategy development. Ideal for presentations showcasing trends in financial technology and stock market performance.
Powered by 


downloads
Tags:
More
Credit Photo
If you would like to credit the Photo, here are some ways you can do so
Text Link
photo Link
<span class="text-link">
<span>
<a target="_blank" href=https://pikwizard.com/photo/digital-financial-data-display-tracking-market-trends/37792fb6a5a02409e25bf26116b71a65/>PikWizard</a>
</span>
</span>
<span class="image-link">
<span
style="margin: 0 0 20px 0; display: inline-block; vertical-align: middle; width: 100%;"
>
<a
target="_blank"
href="https://pikwizard.com/photo/digital-financial-data-display-tracking-market-trends/37792fb6a5a02409e25bf26116b71a65/"
style="text-decoration: none; font-size: 10px; margin: 0;"
>
<img src="https://pikwizard.com/pw/medium/37792fb6a5a02409e25bf26116b71a65.jpg" style="margin: 0; width: 100%;" alt="" />
<p style="font-size: 12px; margin: 0;">PikWizard</p>
</a>
</span>
</span>
Free (free of charge)
Free for personal and commercial use.
Author: People Creations
Similar Free Stock Images
Loading...

Premium


Premium


Premium

Premium


Premium

Premium

Premium


Premium


Premium


Premium

Premium


Premium


Premium


Premium


Premium


Premium


Premium


Premium


Premium
Premium


Premium


Premium


Premium


Premium


Premium


