
- Home >
- Stock Photos >
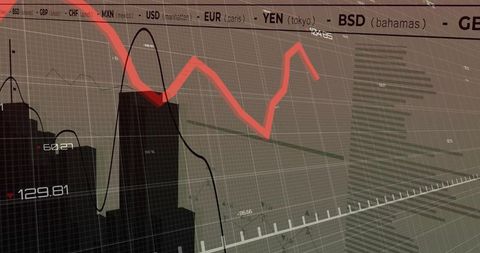
- Digital Financial Data Interface on Green Background
Digital Financial Data Interface on Green Background Image

Dynamic representation of financial data processing over a green background, ideal for illustrating concepts related to global finances, stock market trends, and digital analysis. Suitable for use in presentations, reports, and websites focusing on economic trends, investment strategies, or financial technology solutions.
Powered by 


downloads
Tags:
More
Credit Photo
If you would like to credit the Photo, here are some ways you can do so
Text Link
photo Link
<span class="text-link">
<span>
<a target="_blank" href=https://pikwizard.com/photo/digital-financial-data-interface-on-green-background/9ff7795495d51df3c34ed0533ef7c48a/>PikWizard</a>
</span>
</span>
<span class="image-link">
<span
style="margin: 0 0 20px 0; display: inline-block; vertical-align: middle; width: 100%;"
>
<a
target="_blank"
href="https://pikwizard.com/photo/digital-financial-data-interface-on-green-background/9ff7795495d51df3c34ed0533ef7c48a/"
style="text-decoration: none; font-size: 10px; margin: 0;"
>
<img src="https://pikwizard.com/pw/medium/9ff7795495d51df3c34ed0533ef7c48a.jpg" style="margin: 0; width: 100%;" alt="" />
<p style="font-size: 12px; margin: 0;">PikWizard</p>
</a>
</span>
</span>
Free (free of charge)
Free for personal and commercial use.
Author: Awesome Content
Similar Free Stock Images

Premium


Premium


Premium


Premium

Premium


Premium


Premium


Premium

Premium


Premium


Premium


Premium


Premium


Premium


Premium


Premium


Premium


Premium


Premium


Premium


Premium


Premium


Premium


Premium


Premium


Explore More Free Stock Images